Risk Management
0DTE Strangle: 374 Sessions of Real Traded Prices
A 0DTE strangle — one cheap out-of-the-money call, one cheap out-of-the-money put, bought together before the market picks a direction — is one of the most attractive-looking ideas in options. The risk is capped at a few dollars, the payoff is convex, and you do not have to be right about direction. On the day it works it is spectacular.
We had one of those days on 3 September 2026, with real fills. Then we tested the same structure on 374 sessions of real traded option prints, and the two answers are so far apart that the gap is the lesson.
The day it works, priced from the actual chain
Here is the real 0DTE chain at 10:16 ET on 3 September, SPY at 768.61:
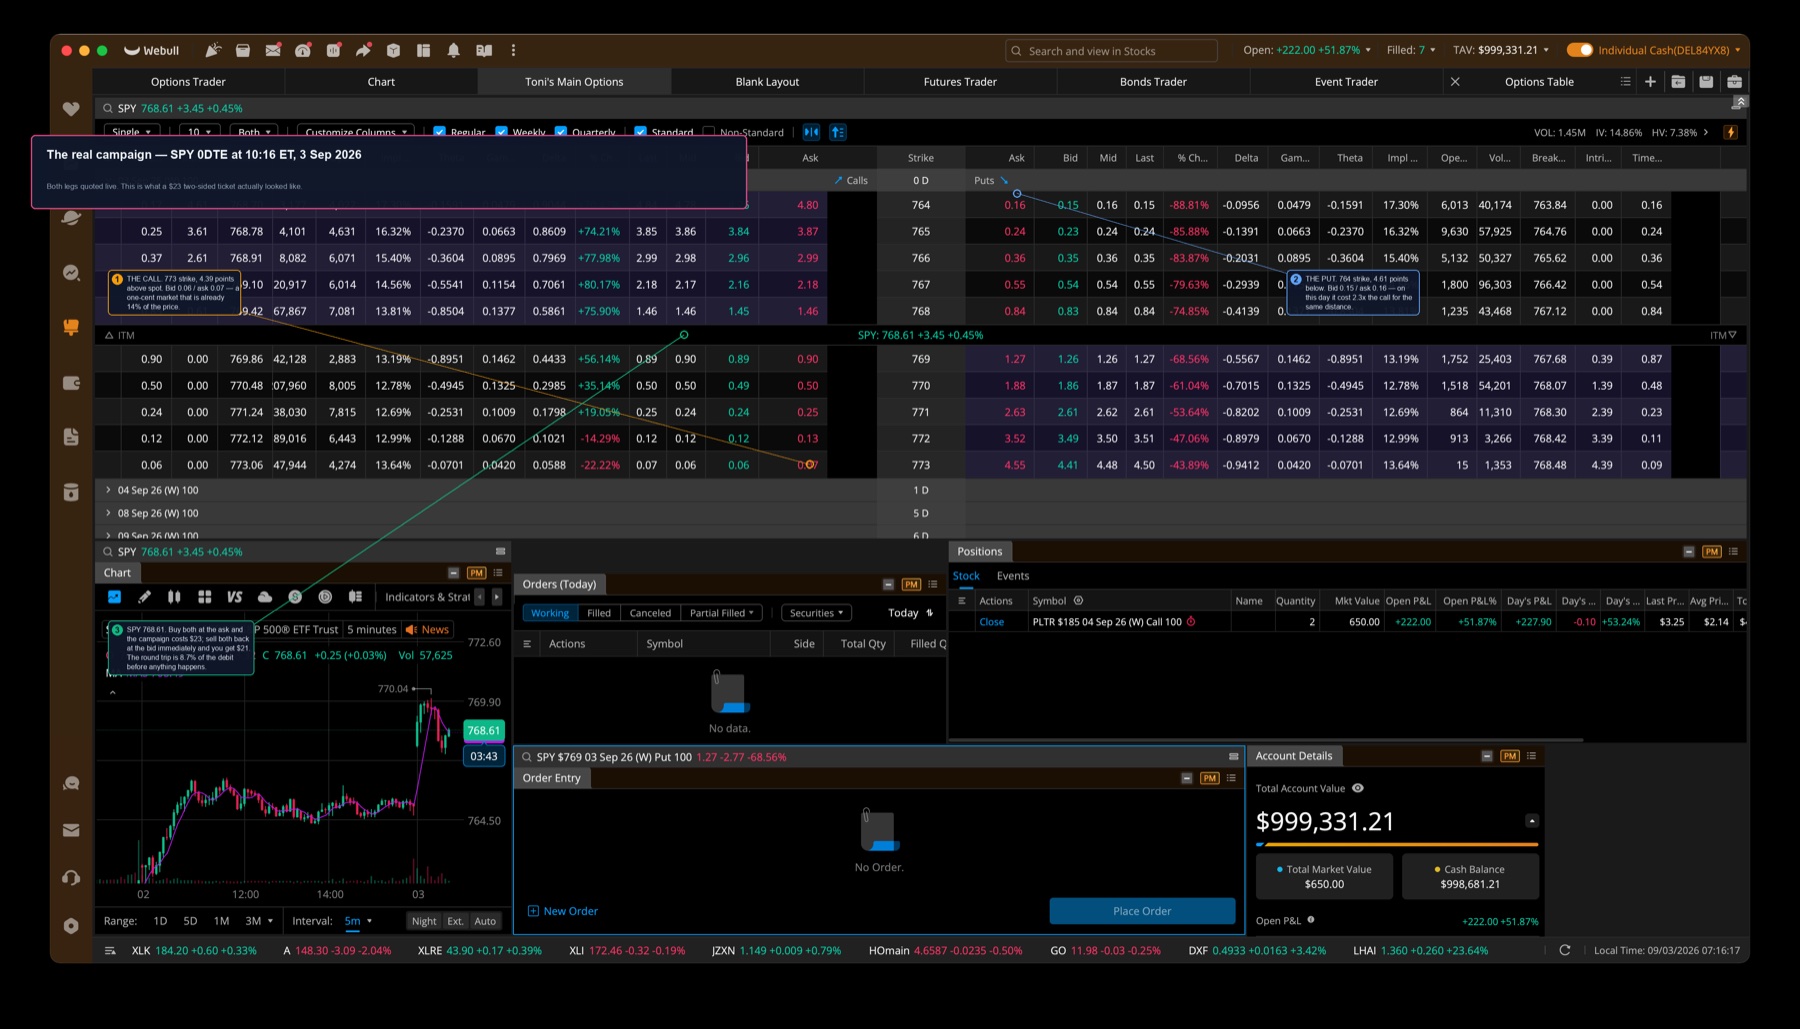
SPY then ran to a session high of 773.37 by 14:15. Repricing the call along the actual path — calibrated to the real $0.07 fill rather than to any displayed implied volatility — gives:
That is a real trade with real numbers, and it is genuinely excellent. It is also why this idea is so hard to let go of.
The problem: cheap enough and close enough are different strikes
The strategy has two rules that sound compatible and are not: buy 4–5 points out of the money, and keep each leg between $0.05 and $0.20.
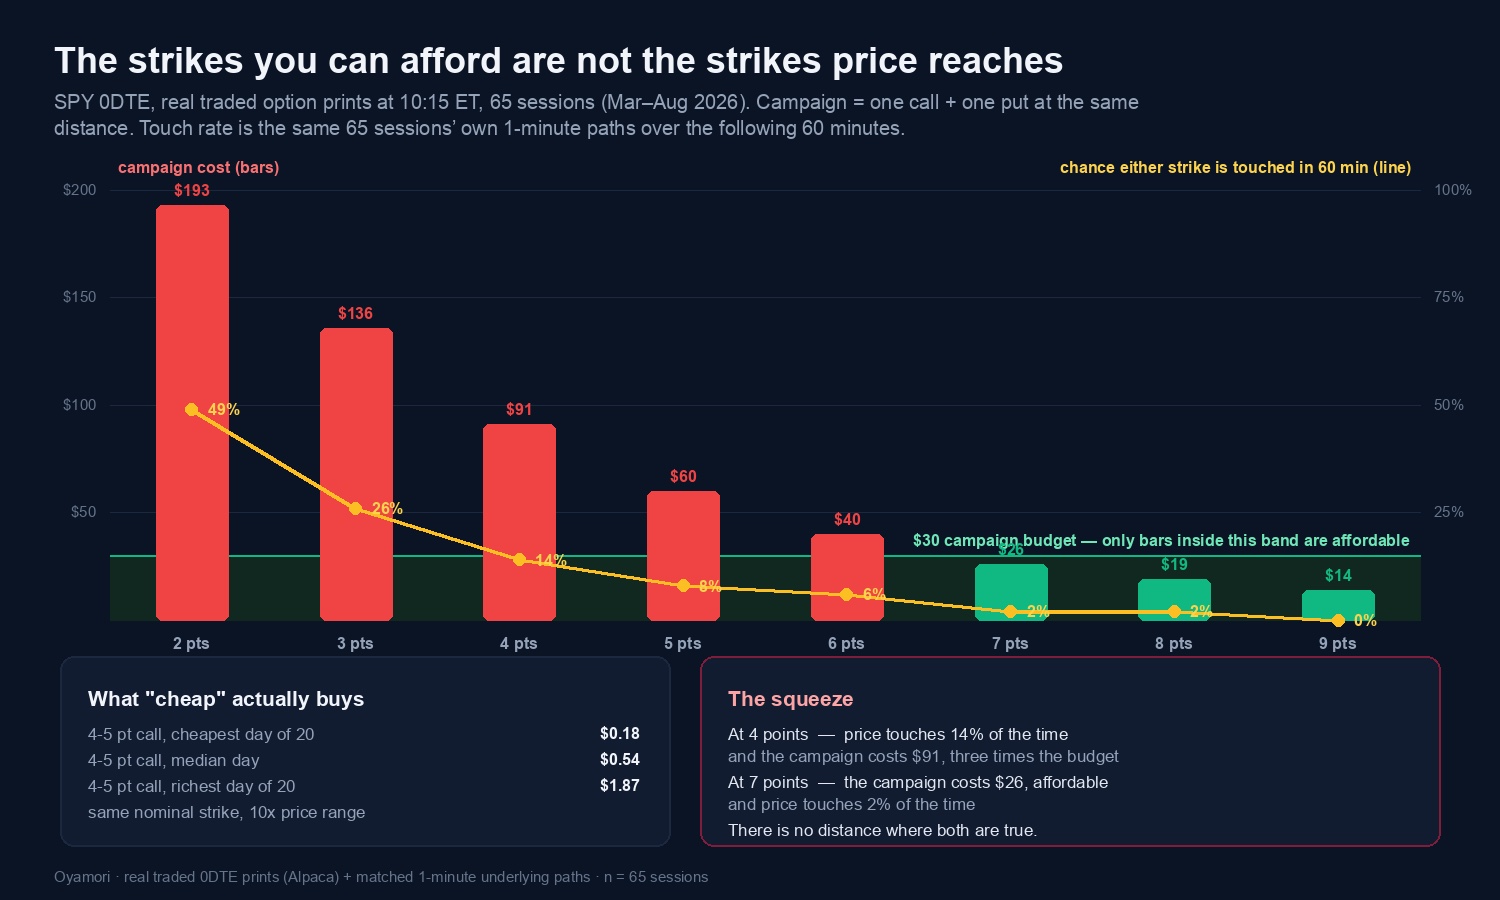
We measured what those distances actually cost. Real traded 0DTE prints at 10:15 ET across 65 SPY sessions:
| Distance | Call | Put | Campaign | Either strike touched within 60 min |
|---|---|---|---|---|
| 2 pts | $1.47 | $0.46 | $193 | 49% |
| 3 pts | $1.02 | $0.34 | $136 | 26% |
| 4 pts | $0.64 | $0.27 | $91 | 14% |
| 5 pts | $0.40 | $0.20 | $60 | 8% |
| 6 pts | $0.25 | $0.15 | $40 | 6% |
| 7 pts | $0.14 | $0.12 | $26 | 2% |
| 8 pts | $0.09 | $0.10 | $19 | 2% |
| 9 pts | $0.06 | $0.08 | $14 | 0% |
At 4 points the campaign costs $91 — three times the budget. At 7 points it costs $26 and the underlying gets there 2% of the time. On the measured medians, 86% of sessions blow a $30 cap if you insist on 4–5 points on both sides.
Move the slider and watch the two conditions refuse to meet:
The mechanism does not hold either
The entry logic says: wait for a mature compression, because compression precedes expansion. That is testable directly, without any options involved.
Measured on SPY 1-minute bars, day-clustered so each session counts once:
Compression does not predict expansion. Low volatility mostly begets more low volatility.
The trap we nearly published instead
The first version of this test sampled every minute with a 60-minute forward window and returned what looked like a decisive answer at n = 103,014. That n was fictional — overlapping windows on the same session are not independent observations, and the real sample was 236 sessions. Re-run day-clustered, the same data gives a clean null. Any study of intraday setups that reports five- or six-figure sample sizes from overlapping windows is reporting a confidence interval that cannot be true.
There is a second-order consequence that matters more than the null itself: the compression rule tends to arm around 10:48 ET — into the quietest, most theta-heavy stretch of the day. The trigger does not just fail to help; it systematically selects the worst hour to own a decaying option.
What the structure actually returned
On real traded 1-minute option bars, 374 sessions, both fill conventions:
| Configuration | n | Return on debit | 95% interval |
|---|---|---|---|
| Blind arm 09:45, harvest 1.5×, optimistic fill | 283 | −19.8% | ±8.9 |
| Blind arm 09:45, harvest 2.0×, pessimistic fill | 283 | −35.3% | ±10.6 |
| Compression-armed, harvest 2.0×, optimistic | 189 | −44.9% | ±13.0 |
| Compression-armed, harvest 3.0×, optimistic | 189 | −59.5% | ±14.2 |
| Compression-armed, 2.0×, 60-minute stop | 189 | −10.0% | ±6.0 |
Every cell negative. Every interval excludes zero. And the trigger made it worse — −44.9% armed against −26.2% blind on the same strikes, ladder and fills.
The second strike almost never arrives
The most appealing part of the idea is the leg you keep: the loser rides on as a free ticket in case the move reverses.
Of the sessions where the first leg reached 2× the campaign cost, the opposite leg subsequently reached 2× in 0 of 9, with a median subsequent peak of 0.22× campaign cost.
The reason is mechanical rather than bad luck. Once one side expands, the other is further out of the money and has less time remaining — both inputs move against it simultaneously. And it was never free: you paid for it in the debit. Calling it a free ticket is mental accounting, and on 3 September that "free" put was 70% of the entire campaign cost for a leg that was never once live.
Even with perfect foresight and zero spread — exiting at the single highest print of the session — the premium-anchored version reaches 2× campaign cost on only 25% of sessions.
The part that generalises: you can refute this, you cannot confirm it
This is the finding we would keep if we had to throw away everything else.
The measured effect here is a loss of 10–60% of debit. The minimum detectable effect at the sample sizes available is:
| Campaigns | MDE, hold to expiry | MDE, 60-min stop |
|---|---|---|
| 100 | ±25.5 pp | ±11.8 pp |
| 200 | ±18.0 pp | ±8.3 pp |
| 400 | ±12.7 pp | ±5.9 pp |
Now count what SPY can actually supply. About 630 sessions have traded 0DTE option bars; a compression rule arms on 74% of them; the target contract has a print at the arming minute on 76% of those; split off a holdout and you are left with roughly 100 holdout campaigns.
The asymmetry is the useful part: a large negative is detectable at n = 100, a modest positive is not.
What we are committing to, in public
Because a scoping run cannot confirm anything, here is the specification we will run, declared before we look — so that if it comes back positive it means something:
ARM      first minute where the trailing 20-bar mean range ÷ 14-day ATR is at or below
         the 30th percentile of the PRIOR 20 sessions, between 09:50 and 14:30 ET.
         One campaign per session. No-arm sessions recorded, not discarded.
ARMS     A: strike nearest 0.55 ATR out of the money, no premium constraint
         B: strike nearest $0.12 within the $0.05–0.20 band, distance unconstrained
LADDER   harvest the first leg at 1.5x campaign cost; secondary rungs 2.0x, 3.0x
EXITS    primary 60-minute mark-to-last-print; secondary hold to expiry
FILLS    reported as a bracket — optimistic and pessimistic — never one alone
METRIC   return on debit per campaign, day-clustered bootstrap interval,
         reported with median, P(r>0), the top-3 share of total profit, and log growth
CONTROLS random minute, the trigger's own off-state, single-leg, time-matched random
HOLDOUT  untouched from 2026-03-01 onward; training figure committed in writing first
GUARD    no point estimate published below 400 campaigns
And the four things that would change our minds, also declared now: a pessimistic-fill result positive with an interval excluding zero on the holdout; the effect surviving both the random-minute and off-state controls; the compression mechanism replicating on its own; and positive log growth, not just a positive average.
Why a refutation can be published from a scoping run when a confirmation cannot
Pre-registration exists to stop an analyst fishing for a positive result — trying rules until one works, then presenting it as though it were the first thing tried. That process cannot manufacture a negative. If anything the bias runs the other way: an analyst picks the rule they believe will work, so a rule chosen freely and still losing 20–60% of debit across every cell is evidence pointing away from the hypothesis more safely than the same process pointing toward it. That is why the grid above is publishable as directional evidence, and why the pre-registered spec still has to be run before anyone — including us — claims the opposite.
So what do you do with cheap convexity?
Not nothing. Three honest uses survive everything above:
| Still defensible | Not supported | |
|---|---|---|
| Event risk | buying a tail before a known binary, sized as insurance | — |
| Sizing | a defined-loss ticket as a small share of a larger plan | — |
| Reading | the chain tells you what the market thinks is reachable | — |
| Cost | pay for reach, not for cheapness | — |
| As a daily strategy | — | −10% to −60% of debit per campaign, 374 sessions |
| Compression as the trigger | — | null mechanism, and it arms at the worst hour |
| The free reversal ticket | — | 0 of 9, median subsequent peak 0.22x |
| Cheapness as the strike rule | — | it buys distance you cannot reach |
The deepest problem is that cheapness and reachability are the same axis viewed from opposite ends. A $0.07 ticket is $0.07 because the market has priced how rarely it pays — and the market is not wrong about that in any way we have been able to measure. This is the same conclusion our 0DTE strike selection work reached from the reachability side, and the same one the cost floor reaches from the spread side.
The takeaway
- Price the campaign before you admire the payoff. At 4 points out, both legs cost about $91, not $23. The $23 version lives 7 points out, where price arrives 2% of the time.
- Never model a cheap option's premium from a displayed IV. It overpriced our real $0.07 ticket by 13×.
- Compression does not predict expansion — +0.0055 ATR, interval [−0.0071, +0.0182], n = 236 sessions.
- The kept leg is not free. You paid for it, and it reached 2× in 0 of 9 opportunities.
- Ask what n your evidence has. Below a few hundred campaigns you can detect a disaster and not an edge — which means a good-looking year proves far less than it feels like it does.
The day it works will always be more vivid than the 373 that did not. That asymmetry of memory is the actual opponent.