INDICATOR · Scalping / Confluence
Oyamori A+ Scalp Dashboard
Six intraday gates, each scored with a live hit rate on your own chart, feeding a dual EMA9 cloud stack and a full trade ticket — sample size printed next to every number.
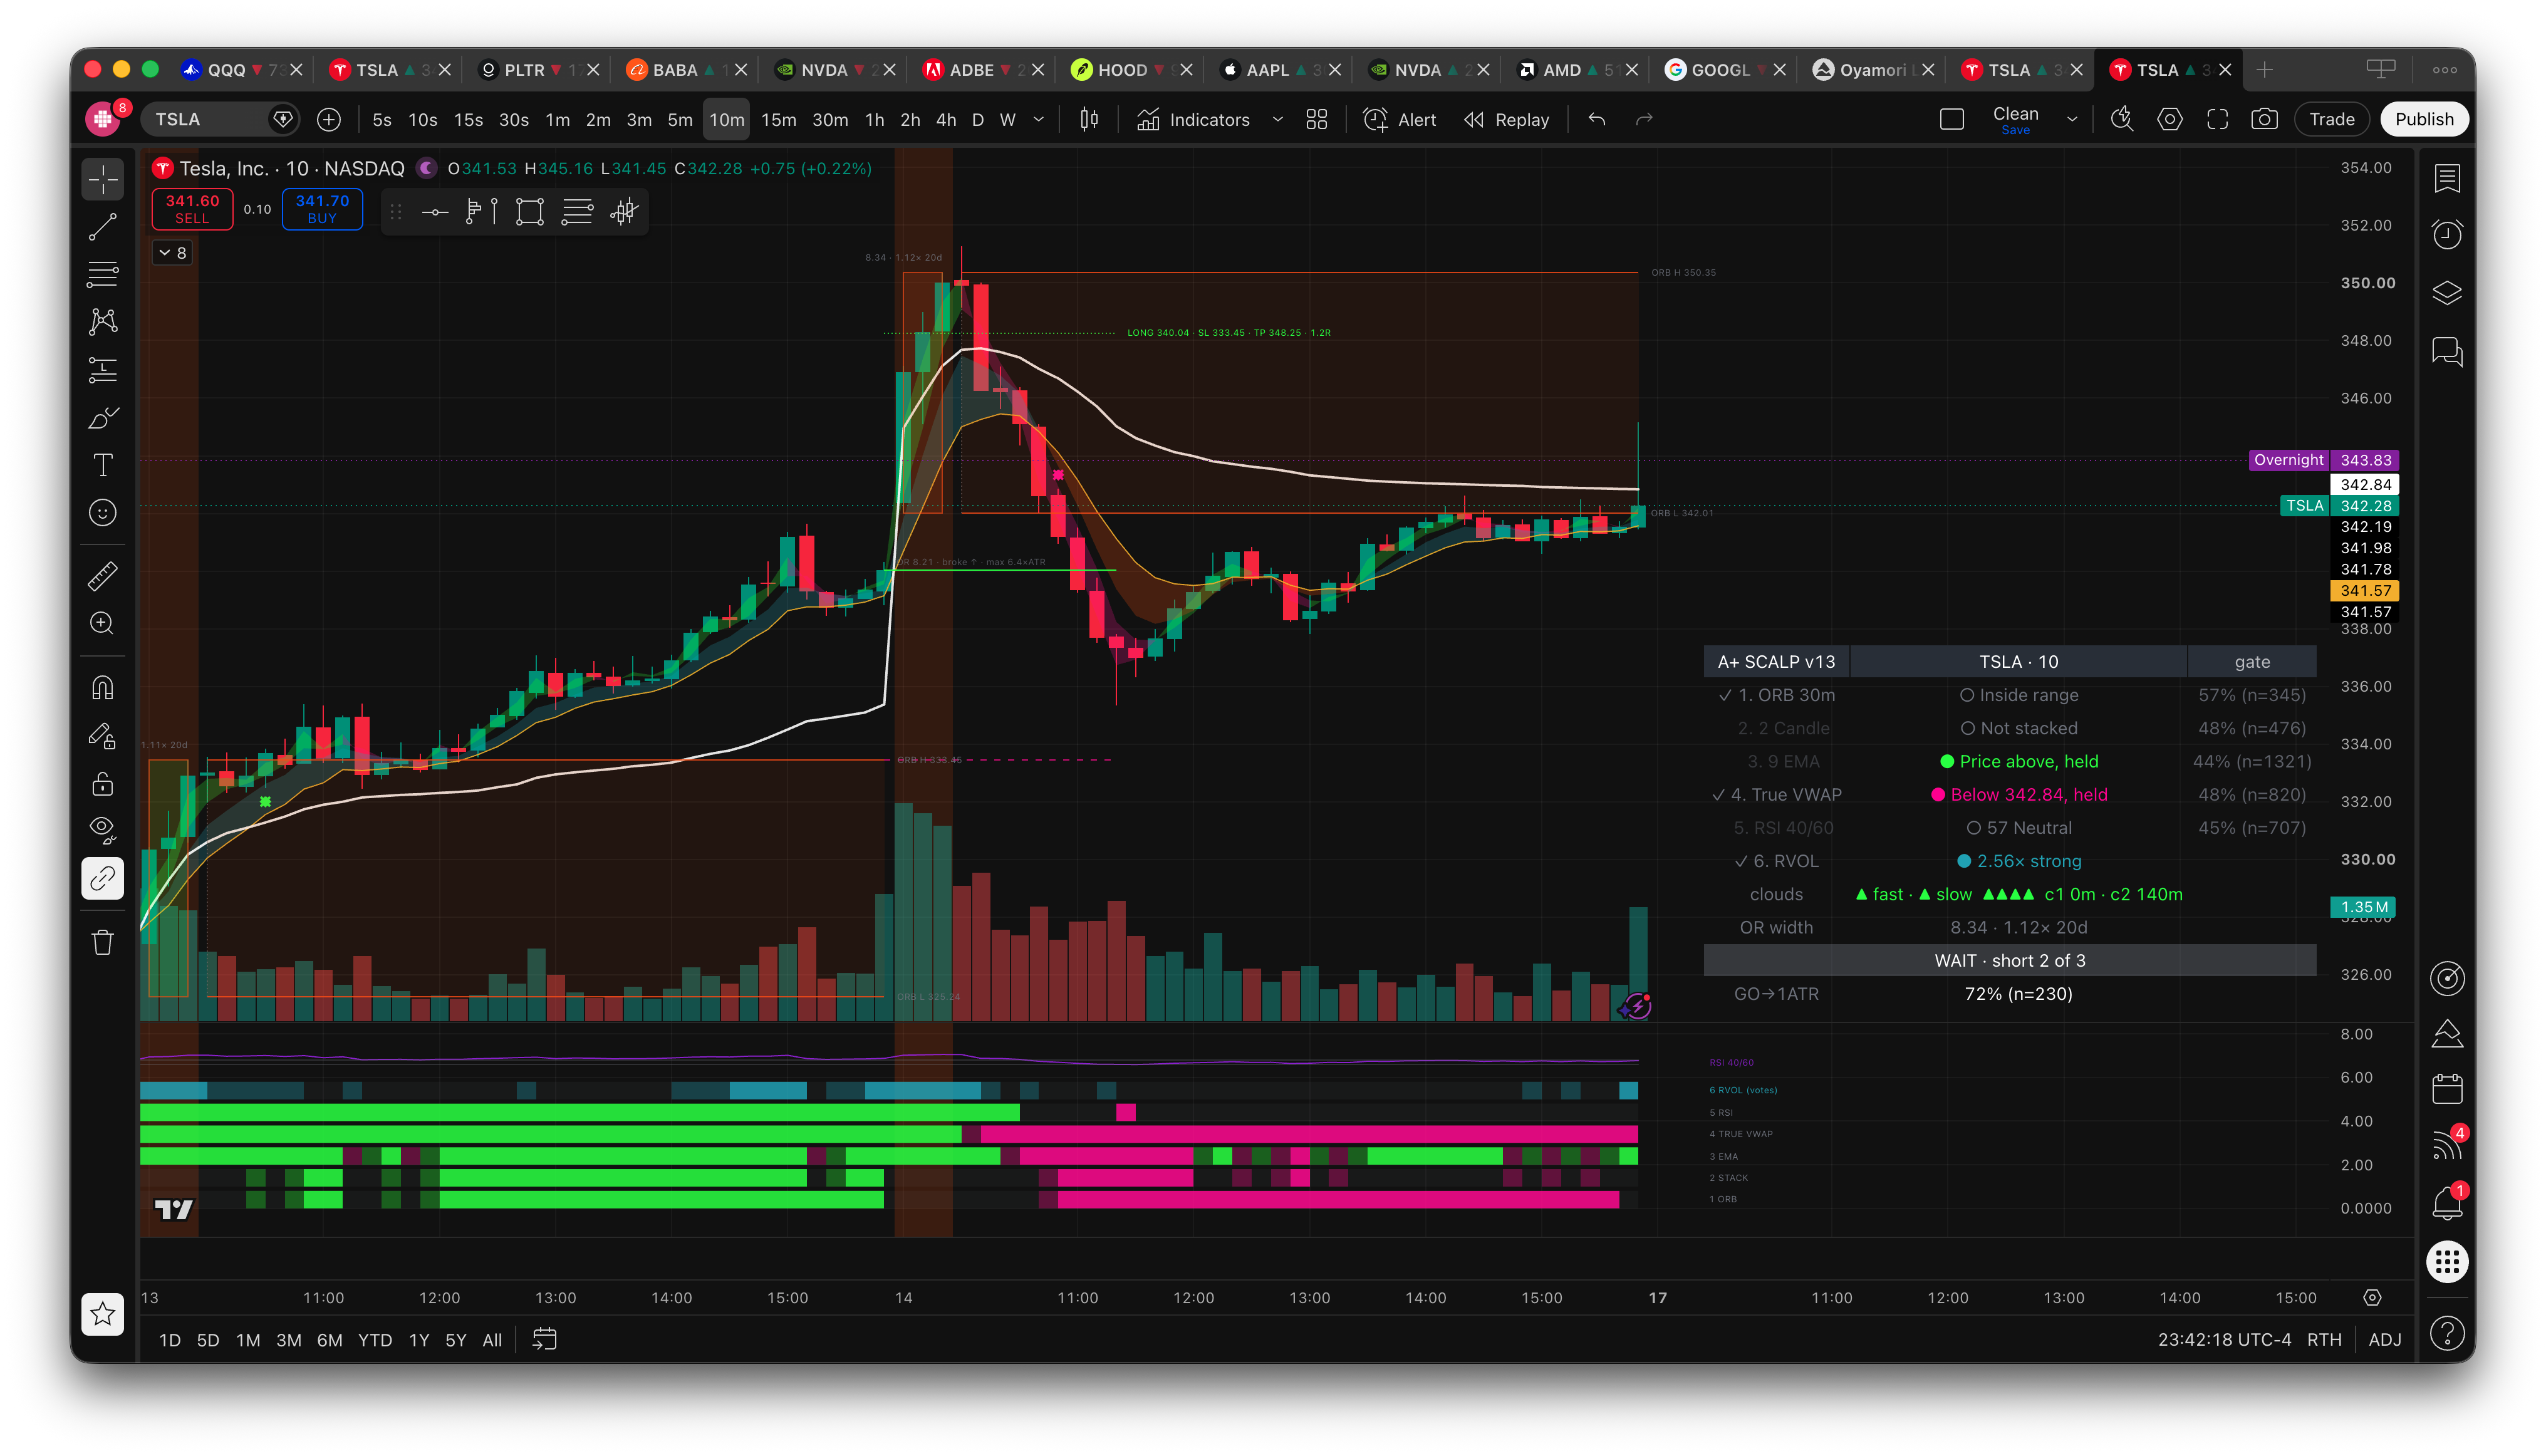
TSLA 10m. The dashboard reads WAIT · short 2 of 3 — True VWAP and RVOL agree, the opening-range gate does not, so permission is withheld. Each gate carries its own hit rate and sample size. The opening range, its rays and the trade ticket sit on price; the six condition lanes run in the pane below.
Six intraday conditions, scored against your own chart's history, with the honest answer printed next to each one.
Most checklist indicators tell you how many boxes are ticked. This one tells you which boxes have ever been worth ticking — every gate carries a live hit rate measured on the symbol and timeframe you are looking at right now, with its sample size beside it.
The six gates
| # | Gate | Asks |
|---|---|---|
| 1 | Opening Range 30m | Is price outside the range, and did the break hold |
| 2 | 2 Candle | Two consecutive closes in the same direction |
| 3 | 9 EMA | Which side of the EMA, and held there |
| 4 | True VWAP | Session-anchored, on a fixed source timeframe |
| 5 | RSI 40/60 | The neutral band as a filter, not an overbought toy |
| 6 | RVOL | Relative volume vs a regular-session-only baseline |
Each gate has three states, not two: false, true but not yet held, and held for the required bars. The middle state is the wick that is about to fail — a two-state checklist cannot express it, and that is most of what separates a real signal from a screenshot.
Which gates vote
By default only ORB, True VWAP and RVOL count toward the GO permission chip. The other three display, hold and score, but do not vote.
That default was not chosen by taste. It came out of the per-gate hit-rate column:
| Gate | Hit rate | Samples |
|---|---|---|
| ORB 30m | 55% | n=345 |
| True VWAP | 51% | n=820 |
| 2 Candle | 44% | n=476 |
| RSI 40/60 | 43% | n=707 |
| 9 EMA | 41% | n=1,321 |
The 9 EMA — the gate most checklists treat as foundational — was the worst performer in the set, across the largest sample in the script. That is the kind of thing a hit-rate column exists to find.
Every gate is a toggle. Set them however your own numbers tell you.
Selection bias, stated plainly. Those gates were chosen by winning a comparison on the same history you are now measuring them against. Expect the forward number to be lower than 55%. The GO row exists so you can check that on fresh data rather than trust the default.
Why RVOL is third
Gates 1 through 5 all ask the same shape of question — which side of a level is price on. Intraday, those levels cluster and flip together, so "5 of 5" is closer to one fact repeated five times than to five independent confirmations.
Volume has no side. RVOL cannot pick a direction, so it adds to both sides equally, which makes it a filter rather than a tie-breaker. A three-voter GO reads: ORB and VWAP agree, and the move has participation.
The pane architecture
The script runs as a pane so the lane matrix and RSI curve have a scale of their own, then pushes everything that belongs on price back to the main chart. One script, one settings panel, gates computed once.
On price: opening-range box and rays, break marks, the retest marker, RTH-anchored 9 EMA, True VWAP, two EMA9 clouds, the dashboard and the trade ticket.
In the pane: six condition lanes with per-bar history — so you can see how alignment assembled. Five gates that snapped into place in one bar and five that assembled over twenty bars are the same count and completely different tape.
The EMA9 clouds
Rather than stacking 9, 20 and 50 EMAs, this stacks one EMA across four timeframes and pairs them:
- Cloud 1 — EMA9 at 1m vs 3m — the fast read
- Cloud 2 — EMA9 at 5m vs 10m — the slow confirmation
When both clouds agree, the ladder has genuinely turned. Cloud 1 flipping alone is a guess.
Every EMA in the ladder is fed regular-session-only data. An overnight-contaminated average means something different at 09:45 than it does at 14:00; this one does not.
The trade ticket
When permission fires, the dashboard prints an entry, a stop derived from the opening-range width, a target and the resulting R multiple. The GO row then tracks how often that setup reached 1×ATR before it reached the stop — on this chart, with the sample count shown.
What the numbers aren't
Every hit rate in this script is in-sample and current-chart-only. It is recomputed from the history your chart has loaded. It is not a backtest. It does not model slippage or commission. It changes when you change the symbol, the timeframe, or how far back the data goes.
Sample sizes are printed for exactly this reason — a 60% hit rate on n=12 is noise, and the script does not hide the n from you. No indicator can tell you whether an edge survives out of sample.
Settings
Opening Range        30 minutes          Regular Session   0930-1600
GO Threshold         0 = all voters      VWAP Source       hlc3
Voting gates         ORB · VWAP · RVOL   RVOL strong       ≥ 1.5×
EMA / RSI length     9 / 14              Hit-rate target   1.0 × ATR
Ladder feeds         1m · 3m · 5m · 10m  Dashboard         Bottom Right
84 inputs across seven groups. Everything named above is adjustable, including which gates vote and how many must agree.
Alerts
Four alert conditions plus one bundled dynamic alert carrying full context in its message — GO fires, opening-range breaks, and cascade complete when both EMA9 clouds agree. The cloud-flip marks ship switched off; the alerts behind them fire regardless, so the feature runs headless.
Built for intraday movers on 1m to 10m. Works on any liquid symbol with real volume — the RVOL gate is meaningless without it.
This is an analysis tool, not financial advice. It does not place trades and it does not predict price. Test it on your own symbols before you let it inform a decision.
Author: Toni Maxx — Oyamori.com