INDICATOR · SMC / ICT
Oyamori Liquidity Structure V6.11
One overlay that chains structure, liquidity, zones, and signal — with hit-rate rows scored live on your own chart.
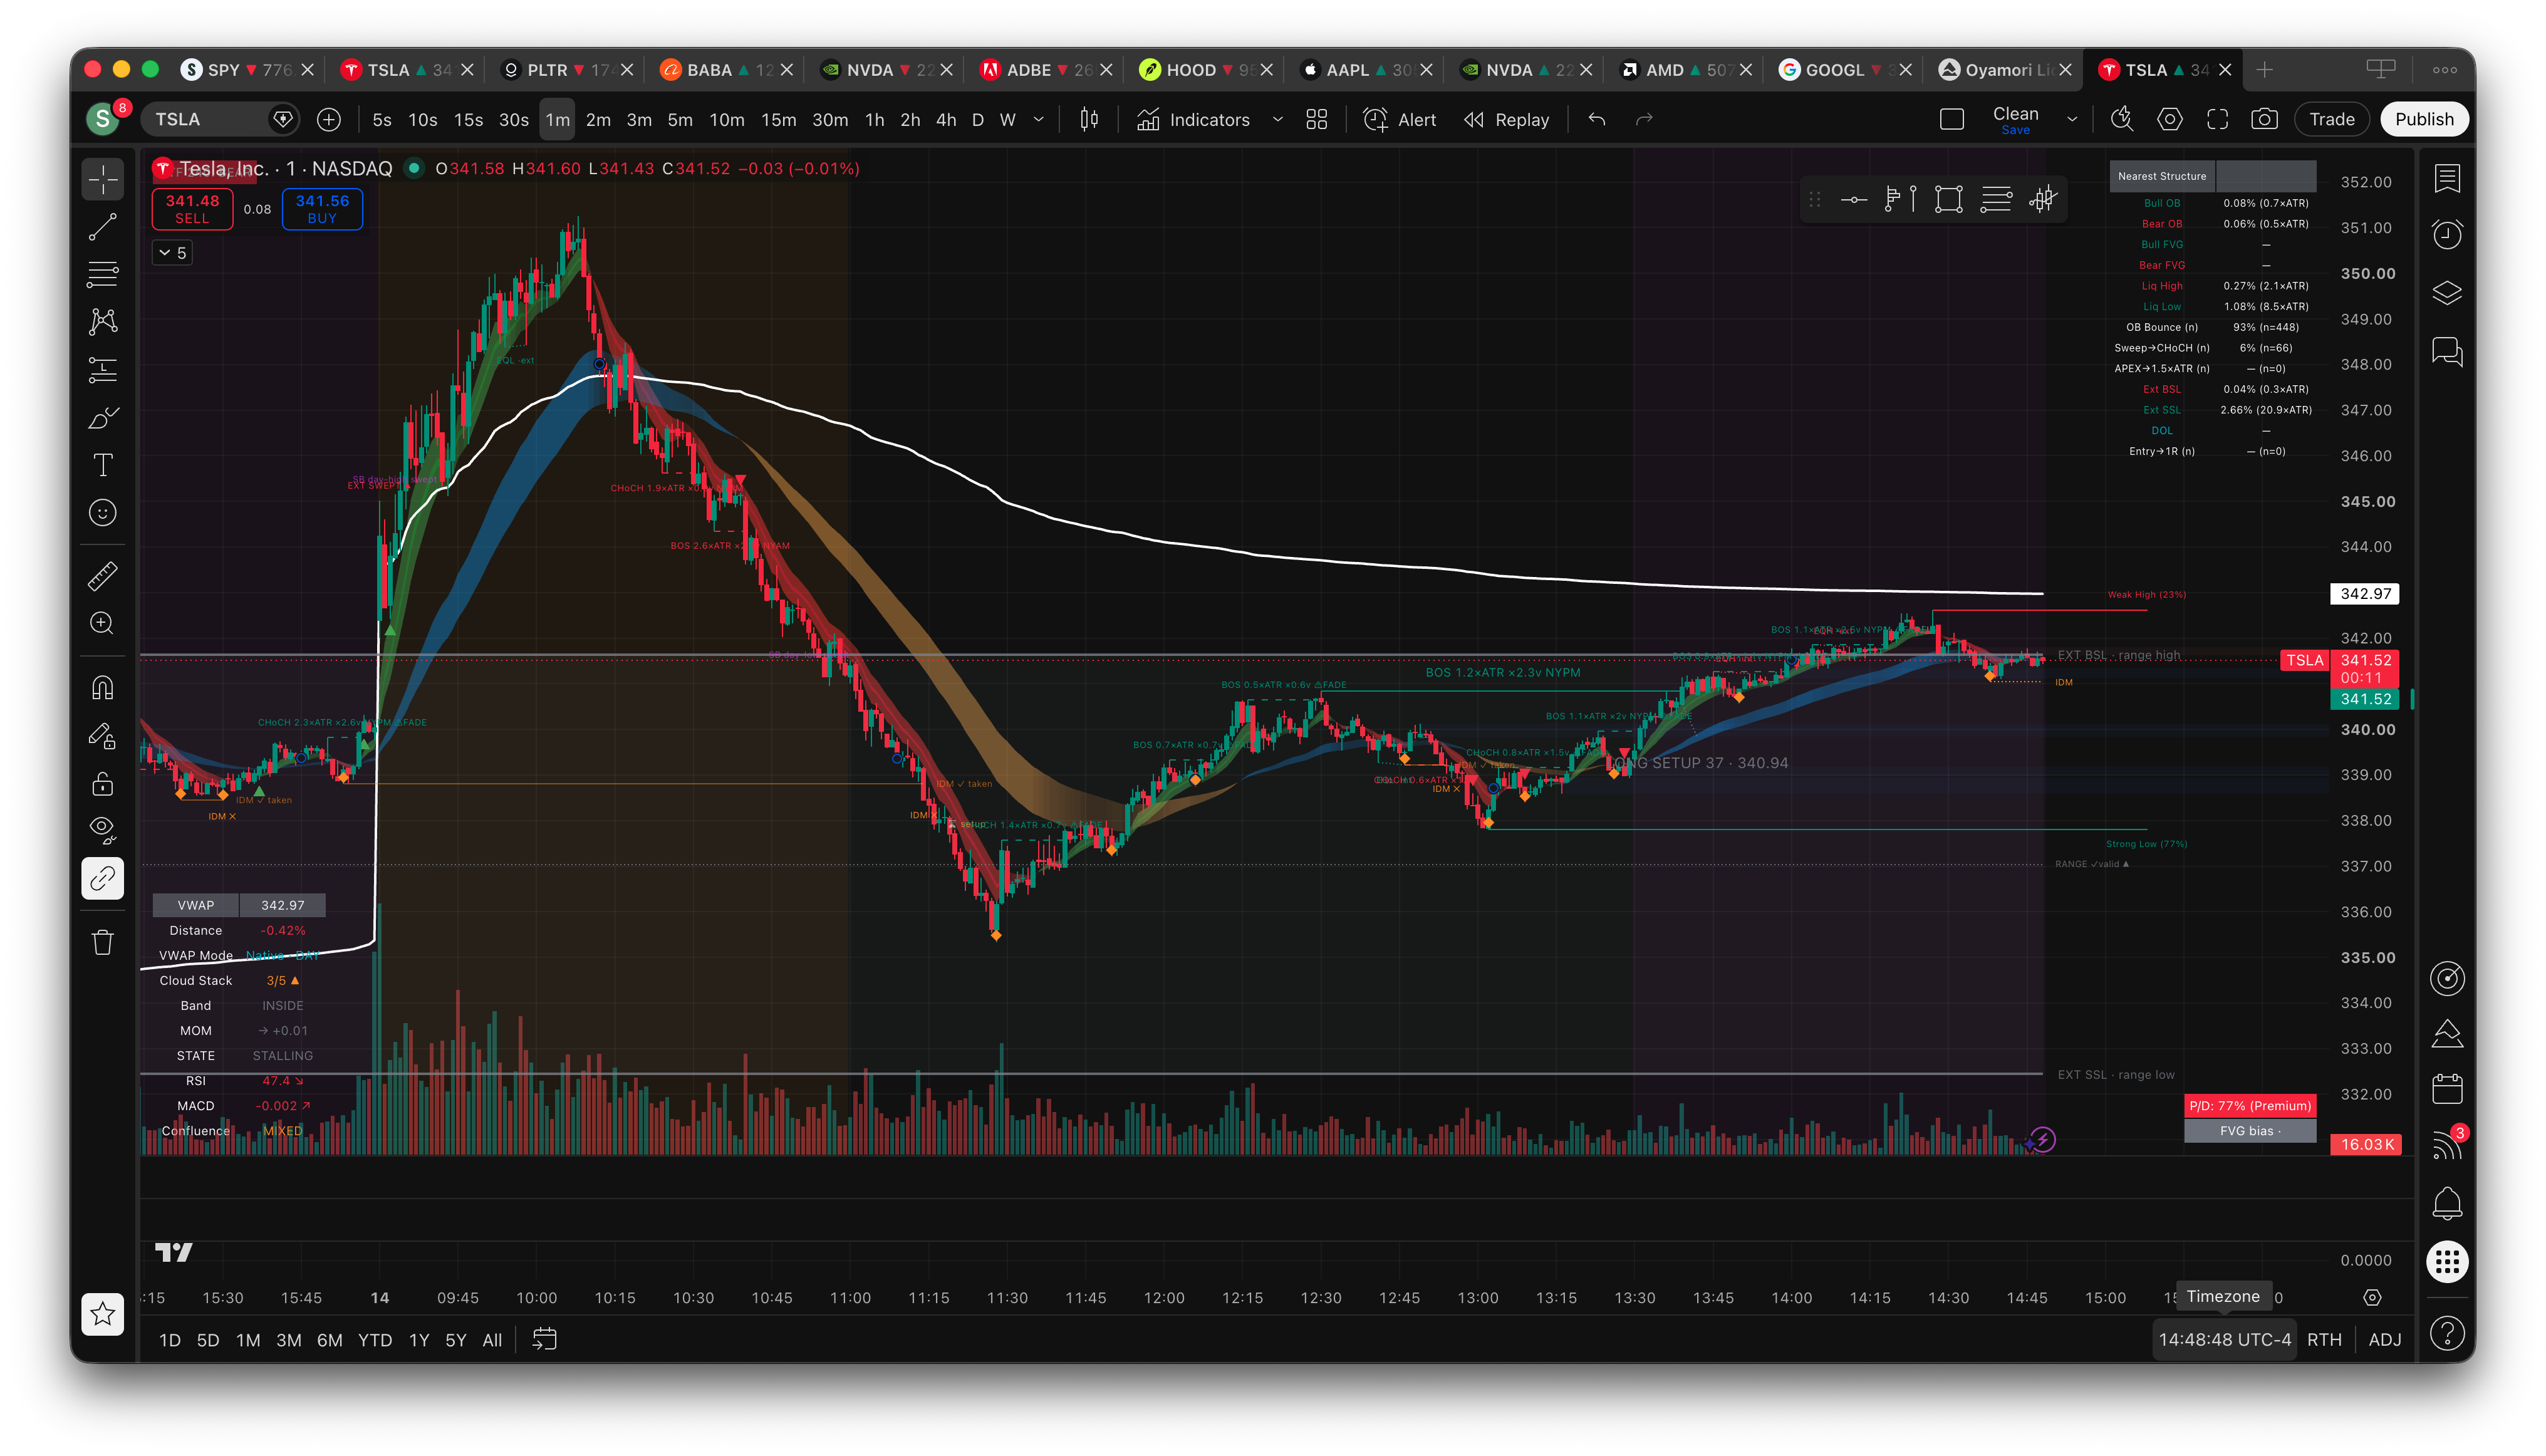
TSLA 1m. Range confirmed, IDM taken twice, EXT BSL/SSL marked, P/D 77% premium. Dashboard figures are in-sample, current-chart-only.
IDM ✓ taken — the range's bait level has been wicked through. This is the entry-permission event: before it fires, any entry sits on the bait side of the range, not the real one.
EXT BSL / EXT SSL — the range's outer boundaries. External buy-side and sell-side liquidity, named for what they are rather than dressed up.
What it does
Oyamori Liquidity Structure runs one honest chain — structure → liquidity → zones → signal — instead of stacking indicators that each answer a different question. Every layer feeds the next, and the last layer is scored on the chart, so you can see whether it has actually worked on your symbol and timeframe.
1. Structure
Two pivot scales: major (default 50-bar) and minor (default 5-bar). A pivot is accepted only when its extreme beats the lookback on both sides, and the accepted sequence must alternate — a second high with no intervening low doesn't open a new swing, it refines the standing one if it's higher (mirrored for lows). That keeps the skeleton clean: every level the script quotes was a real two-sided extreme, not a mid-leg artifact.
Breaks are close-through events that fire once per level, labelled BOS (with the trend) or CHoCH (against it), each stamped with a displacement grade (break-bar range ÷ ATR(200)) and a break RVOL (break-bar volume ÷ its 20-bar average) — so a CHoCH on 0.4×ATR and half-average volume is visibly weak instead of looking identical to a real one.
2. Liquidity
Liquidity pools — a confirmed pivot opens a zone, and every later bar that trades into that band adds a touch and its volume to a running tally, until price closes through. An untested level is just a line; a level that has absorbed forty bars and heavy volume is a pool with stops sitting under it.
- Equal highs/lows marked as engineered liquidity
- Sweeps — a wick beyond a major pivot that closes back inside — labelled with ATR penetration and rejection %
- A sweep confirmed by an opposite minor CHoCH inside the reversal window becomes the classic SWEEP+CHoCH sequence
3. Zones
Order blocks are captured at the canonical origin — the last opposite-direction candle before the break, not "the biggest candle nearby." Each carries a live mitigation %, its premium/discount position, and an OTE flag. On mitigation a block flips role into a breaker instead of vanishing.
Fair value gaps are detected on three confirmed bars of the chosen timeframe with lookahead off, filtered by a minimum gap height in ATR, and carry the CE (50%) midline with a live fill %. A fully filled gap inverts instead of being deleted.
4. The V6 liquidity framework
A trading range is built only from a validated break: the impulse leg must have retraced deeply enough first — 50% valid, 38.2% shallow, below that invalid — and the range confirms only once the inducement is taken. Invalid breaks are labelled IND-S: structural inducement, the fake break engineered from resting liquidity.
Inside an active range:
- IDM line — the bait level whose stops fuel the next leg; flips to IDM taken when wicked (the entry-permission event)
- ·int / ·ext tags — every zone marked as fuel (inside) or target (at a boundary)
- EXT BSL / EXT SSL — the range boundaries, named for what they are
- Draw on Liquidity — the pool price is most likely to seek next, blanking itself when the target is too far away to be a realistic draw
5. Three signals, deliberately non-overlapping
- Composite Setup Score — a 0–100 weighted sum on every major break (displacement, volume, killzone, premium/discount side, sweep confirmation, zone confluence, OTE). Frequent, continuation-flavoured; one strong factor can compensate for a weak one.
- APEX Reversal — seven independent AND-gates wrapped around the sweep+CHoCH trigger: displacement floor, momentum divergence against the RSI recorded at the swept pivot, volume climax with a shallow excursion, a rejection candle pattern, HTF alignment, location confluence, premium/discount side. No weighted compensation — rare by design, and silent when anything is missing.
- Displacement Reversal (DR) — fires on the close of a strong ignition bar at a local extreme, with no structural confirmation at all. It is the fastest and noisiest signal in the script, so it ships OFF.
- Entry Engine — the capstone. Fires only when an active range, a taken IDM, and a defined DOL all hold and price then enters a preferred-class zone. Output is a full ticket: entry, stop at the zone's protective extreme, target at the DOL, an A+/A/B/C grade counting four independent confirmations, and the resulting R:R. Entries below your minimum R:R are still shown, tagged low R:R — never hidden.
Self-validation
Four rolling hit-rate rows sit on the dashboard, each printed with its sample size. Thin-sample rows refuse to print a percentage at all below their guard — rather than showing a confident-looking number built on three trades.
| Metric | Result | Sample |
|---|---|---|
| OB Bounce | 93% | n=448 |
| Sweep→CHoCH | 6% | n=66 |
| APEX→1.5×ATR | — | n=0 |
| Entry→1R | — | n=0 |
In-sample, current-chart-only. One symbol, one timeframe, one session. Not a backtest and not a forward-looking claim.
How to read it
- Is there a range, and is it trustworthy? Look for
RANGE ✓validor~shallow. No range means no validated break was found — the IND-S labels tell you why. - Context. HTF bias badge, premium/discount %, FVG bias.
- Where is price headed? The DOL line is the current magnet. A blank DOL means no trustworthy draw — stand down.
- Permission. Wait for IDM taken in the range direction. Before that, an entry is positioned on the bait side.
- Location. Wait for price to reach a preferred zone (marked ▶), ideally inside the OTE band and on the right side of the range.
- Signal. The ⏳ marker means the preconditions have assembled but price has not reached a zone yet — a watch, not an entry. BUY/SELL plus a ticket is the Entry Engine firing; read the grade and the R:R before acting.
- Trust calibration. Read the
(n=)rows. They are how these signals have actually behaved on this chart.
Settings worth knowing
- Fair Value Gaps ship OFF, and three layers consume gap events — the FVG bias readout, the Silver Bullet entry step, and the Entry Engine on charts below the 60-minute preference cutoff (where gaps are the preferred zone class). On sub-hourly charts the Entry Engine cannot fire with gaps off.
- Displacement Reversal ships OFF, as described above.
- Near-miss "ghost" markers are calibration diagnostics: they appear when exactly one gate failed and name it. Never alerted, never counted in a hit rate.
- Order block origin can be switched from the default last-opposite-candle rule to the leg extreme.
- Every layer has its own toggle, and every drawing group its own colours.
HTF bias badge reads confirmed higher-timeframe bars only.
Fair value gaps are detected with lookahead off on confirmed bars.
Session logic uses running intraday extremes, not a higher-timeframe request.
Honest empty states everywhere: with no active range there are no int/ext tags, no boundary rows, and no DOL — the script shows a dash instead of a stale value.
Version ledger
| Version | What changed |
|---|---|
| V6.11 | Current — Entry Engine ticket output (entry/stop/target/grade/R:R), honest low-R:R tagging instead of hiding entries |
| V6.8 | Silver Bullet — session-scoped day-extreme sweep → MSS → displacement-FVG entry |
| V6.4 | OB-vs-FVG contextual preference by chart timeframe — preferred-zone marker, non-preferred fade |
| V6 | Liquidity framework — validated ranges, IDM permission gate, inducement labelling (IND-S), Draw on Liquidity |
| V3 | OTE zone, killzone gating, inversion FVG, liquidity pool magnitude on EQH/EQL, distance-to-nearest-structure dashboard |
| V1 | Structure grading, order blocks, fair value gaps, liquidity pools, sweeps, killzones |
This is an analysis tool — not a trading system, and not financial advice. It does not predict price. Every number it prints describes what has already happened. Test any configuration on your own symbol and timeframe, and read the hit-rate rows before you trust any of the three signals.
Author: Toni Maxx — Oyamori.com