Oyamori Product · Trading Terminal

One screen. Every timeframe.

20 monitors. One terminal. Oyamori Warroom collapses a wall of charts into a single, real-time options-scalping cockpit.

WARROOM · OVERVIEW · LIVE
Oyamori Warroom dashboard showing a multi-timeframe overview grid — 12 symbols across 10 timeframes with momentum, trend, acceleration, flow, signal, strength, and EMA-cloud signal states in real time

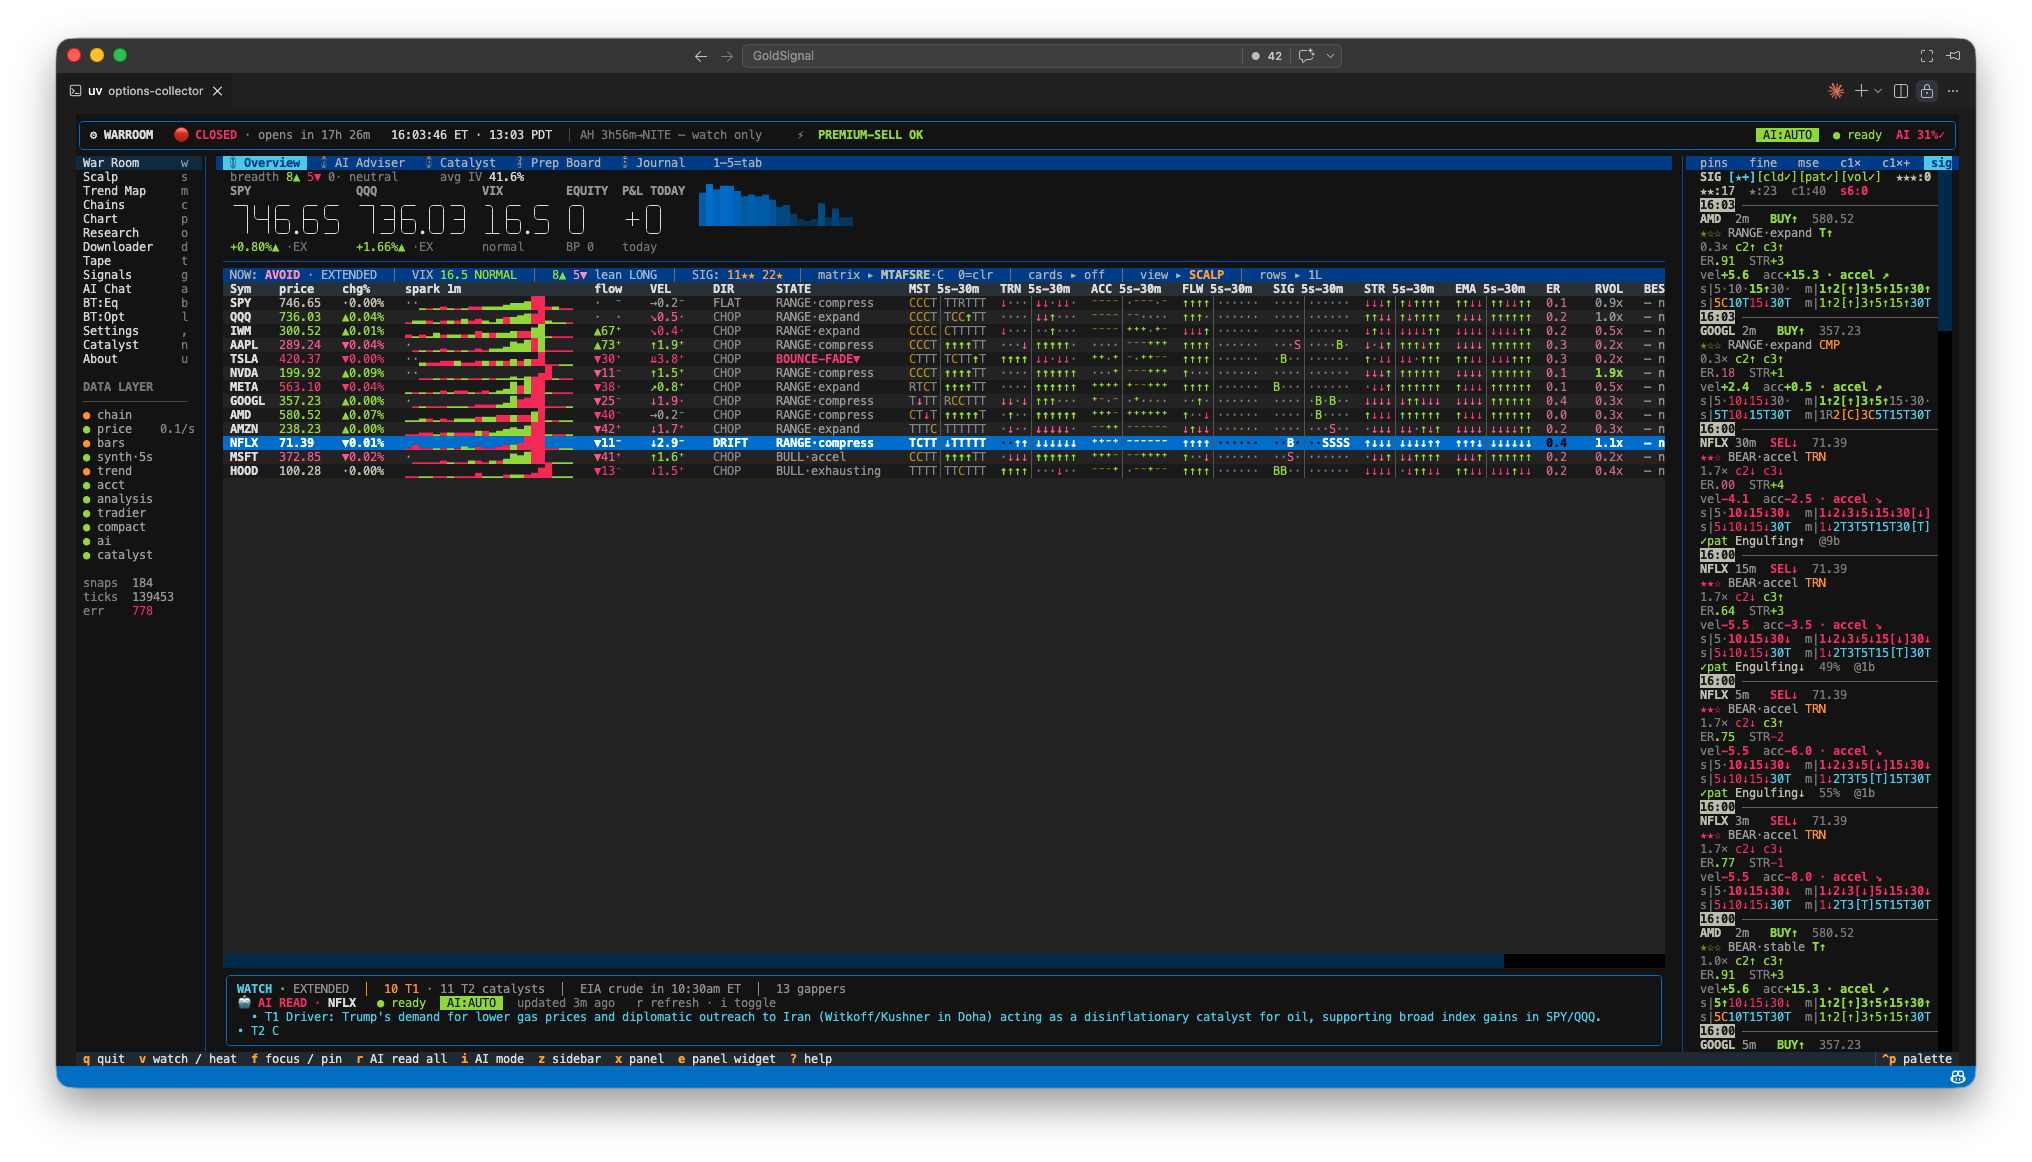
The Warroom Overview — one screen, every symbol, every timeframe.

~950

One Warroom Overview = ~950 live multi-timeframe states — 12 symbols × 10 timeframes (5s → 30m) × 7 signal dimensions — refreshing in real time.

The equivalent of 15–20 TradingView monitors. On one screen.

How ~950 states fit on one screen

12
Symbols on watch
Every symbol tracked across the full timeframe ladder at once — no tab-switching, no missed setups.
10
Timeframes per signal
5s10s15s 30s1m2m 3m5m15m 30m
7
Signal dimensions per timeframe
70 cells per symbol · 840 across the grid — plus spark, flow, velocity, direction, state, efficiency-ratio, RVOL, and best-contract per row.

The seven signal dimensions

DimensionReads
MSTMomentum-state composite
TRNTrend strength (z-score)
ACCAcceleration
FLWVolume / order-flow tilt
SIGSignal fires
STRSignal strength
EMAEMA-cloud alignment (Ripster c1–c4)

Why this beats a monitor wall

01
States, not charts.
Every cell is a pre-computed decision — trend, acceleration, cloud alignment, flow — not a raw candle you still have to read. A monitor wall shows data. Warroom shows the answer.
02
One spine, zero lag.
All ~950 cells read from a single engine computed once per 5-second bar — cross-timeframe confluence at a glance, impossible to see when it’s split across 15 screens — with a light, terminal-fast footprint.

What’s inside Warroom

See everything. Scan nothing.

One screen. Every timeframe.

Stop tab-switching between 15 charts. Oyamori Warroom puts the whole board — 12 symbols, 10 timeframes, 7 signal dimensions — on one screen, refreshed in real time.