Edges
0DTE Lotto Trades: 0 of 80 Days Paid the $0.04 Strike
The 0DTE lotto trade is the cheapest-looking bet on the board: the market opens, a stock flushes to the low of the day, and the far out-of-the-money call four strikes away is asking four cents. Risk $4, catch the snap-back, print. This article tests both halves of that idea against six months of tape — 1,716 symbol-days of one-minute bars and 1,097 real 0DTE contract observations — and the answer splits cleanly in two. The reversal is real and measurable. The $0.04 strike is not a bargain; it is priced correctly for a move that did not happen once in 80 sessions.

What the 0DTE Lotto Trade Actually Claims
The setup has two independent claims stacked on top of each other, and most traders only ever check the first one.
Claim 1 — the Judas leg. Price opens, runs to the extreme of the session, then adjusts back the other way, fast, with momentum behind it. The name comes from the betrayal: the first move is the one that gets you positioned wrong.
Claim 2 — the cheap strike. At that extreme, the contract on the reversal side is at its cheapest of the day. Buy the $0.04 one. If the day works, you paid $4 for a move worth many multiples of that.
Claim 1 is a statement about price. Claim 2 is a statement about options pricing. They are graded separately below, because one of them passes.
The Judas Leg Is Real: 1,716 Sessions Say So
The test: 13 US large caps (TSLA, NVDA, META, AAPL, AMZN, GOOGL, MSFT, AMD, PLTR, COIN, MSTR, SPY, QQQ), every regular session from 20 February to 28 August 2026. For each symbol-day, take the 09:30–10:00 opening window, find which side ran further from the 09:30 open, and measure how far price travelled the other way for the rest of the session.
| Reversal size | Sessions that reached it | 95% confidence interval |
|---|---|---|
| 0.5% or more | 89.3% | 87.7 – 90.7 |
| 1% or more | 68.8% | 66.5 – 70.9 |
| 2% or more | 37.5% | 35.3 – 39.8 |
| 3% or more | 19.9% | 18.1 – 21.8 |
| 5% or more | 5.8% | 4.8 – 7.0 |
Two things fall out immediately. The reversal is common — nearly two thirds of sessions traded back through the 09:30 open at some point. And it is small. The median is 1.55%. That single number ends up deciding the whole trade.
The size of the opening leg predicts the size of the reversal, which is the one genuinely useful conditioning variable in the dataset:
| Opening leg | n | Median reversal | Reaches 2% | Reaches 3% | Back through open |
|---|---|---|---|---|---|
| Under 0.5% | 202 | 0.64% | 5.9% | 3.0% | 84.7% |
| 0.5 – 1% | 455 | 1.24% | 19.8% | 6.2% | 75.4% |
| 1 – 2% | 629 | 1.73% | 43.2% | 19.6% | 61.2% |
| 2 – 3% | 256 | 2.57% | 62.5% | 41.8% | 53.1% |
| Over 3% | 174 | 2.78% | 63.2% | 44.3% | 31.0% |
A violent open gives you a bigger snap-back. A quiet open gives you nothing worth paying a spread for. This is the same liquidity mechanic behind a long lower wick sweep — stops get taken, and the market walks back to where it wanted to trade.
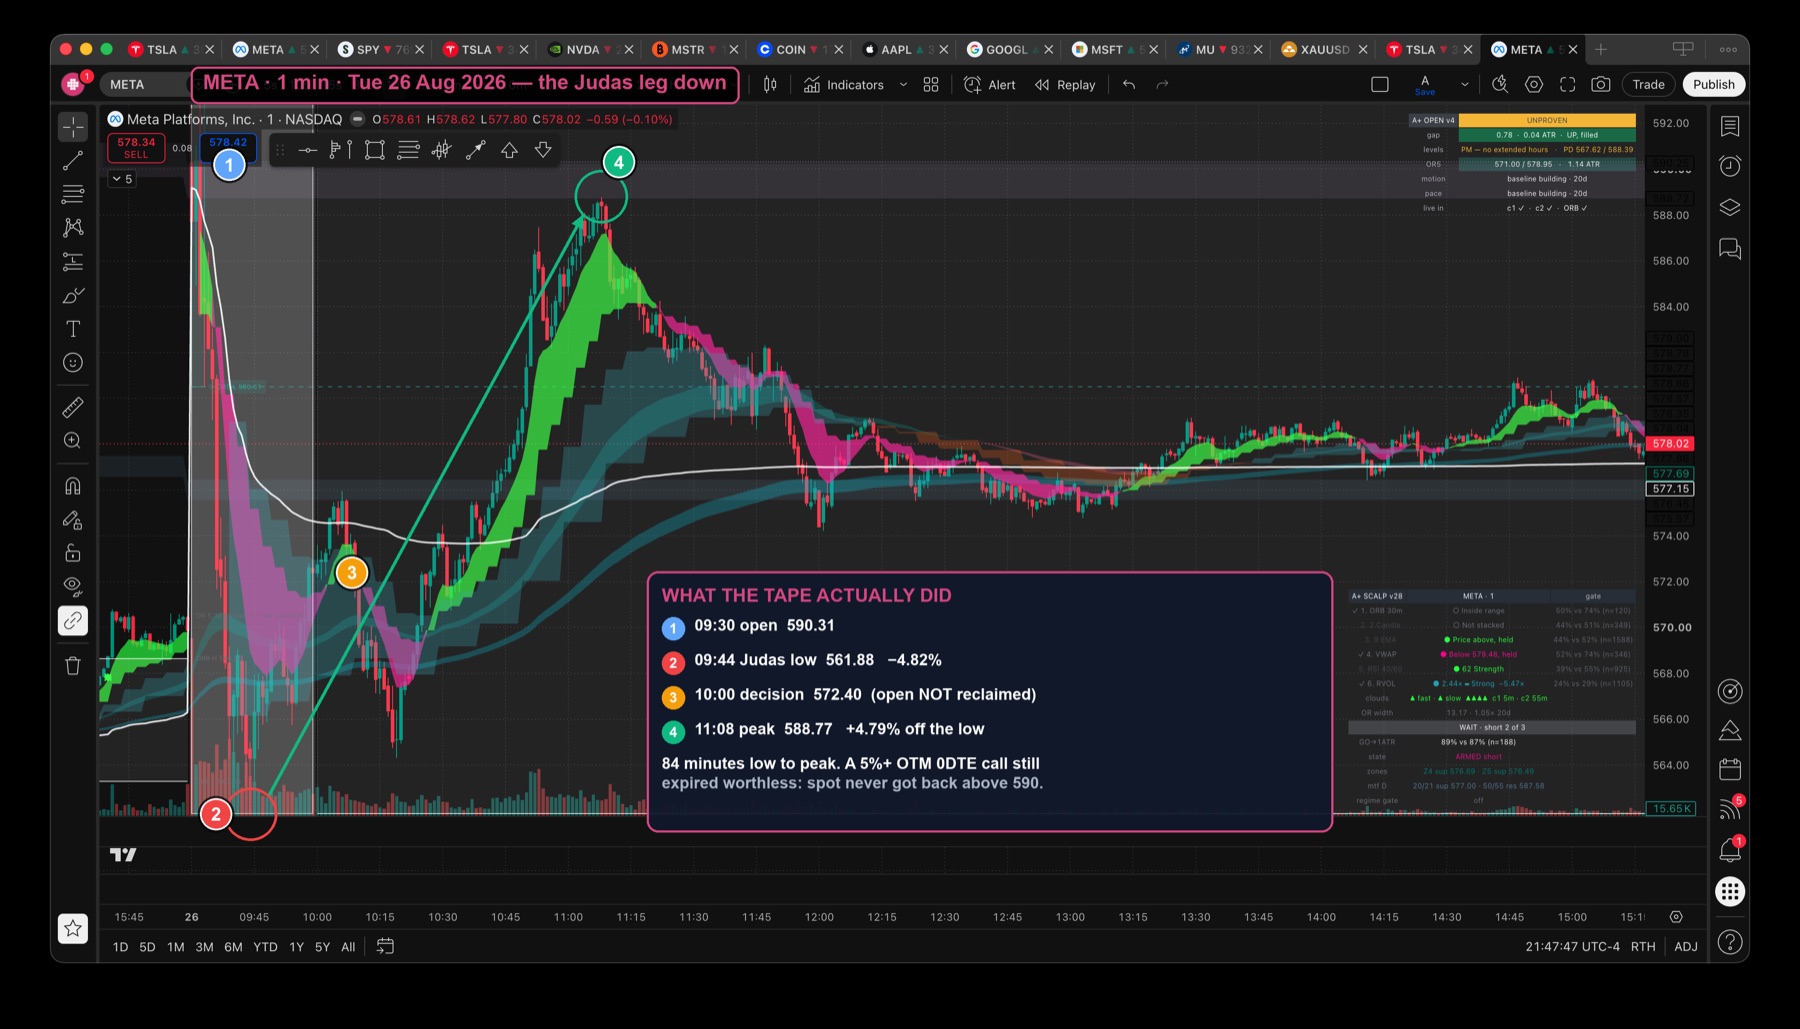
META 26 Aug 2026 — Judas leg down, then 84 minutes back up
Score the leg before you touch a contract — the widget below runs the same bucket lookup as the table above.
Why the $0.04 0DTE Lotto Trade Never Pays
Now claim 2. To grade it honestly you cannot model the option — you have to buy the actual contract that actually traded.
The test: TSLA, every 0DTE expiry day in the same window (TSLA lists Monday, Wednesday and Friday expiries, so 80 days qualify). At 10:00 ET, mechanically fade whichever side ran further in the opening window. Buy the contract on the reversal side priced closest to $0.05, fill at the ask plus a cent of slippage. Then follow that contract, minute by minute, to the close.
The reason is arithmetic, not luck. The contract that costs $0.04 sits a median of 5.55% out of the money. And across those same 80 sessions, the number of times TSLA moved 5% or more in the fade direction after 10:00 was:
Zero out of eighty, 95% confidence interval 0 to 4.6%. The $4 ticket needs a move the stock did not make once in six months. You are not finding a mispricing — you are agreeing with the market's price.
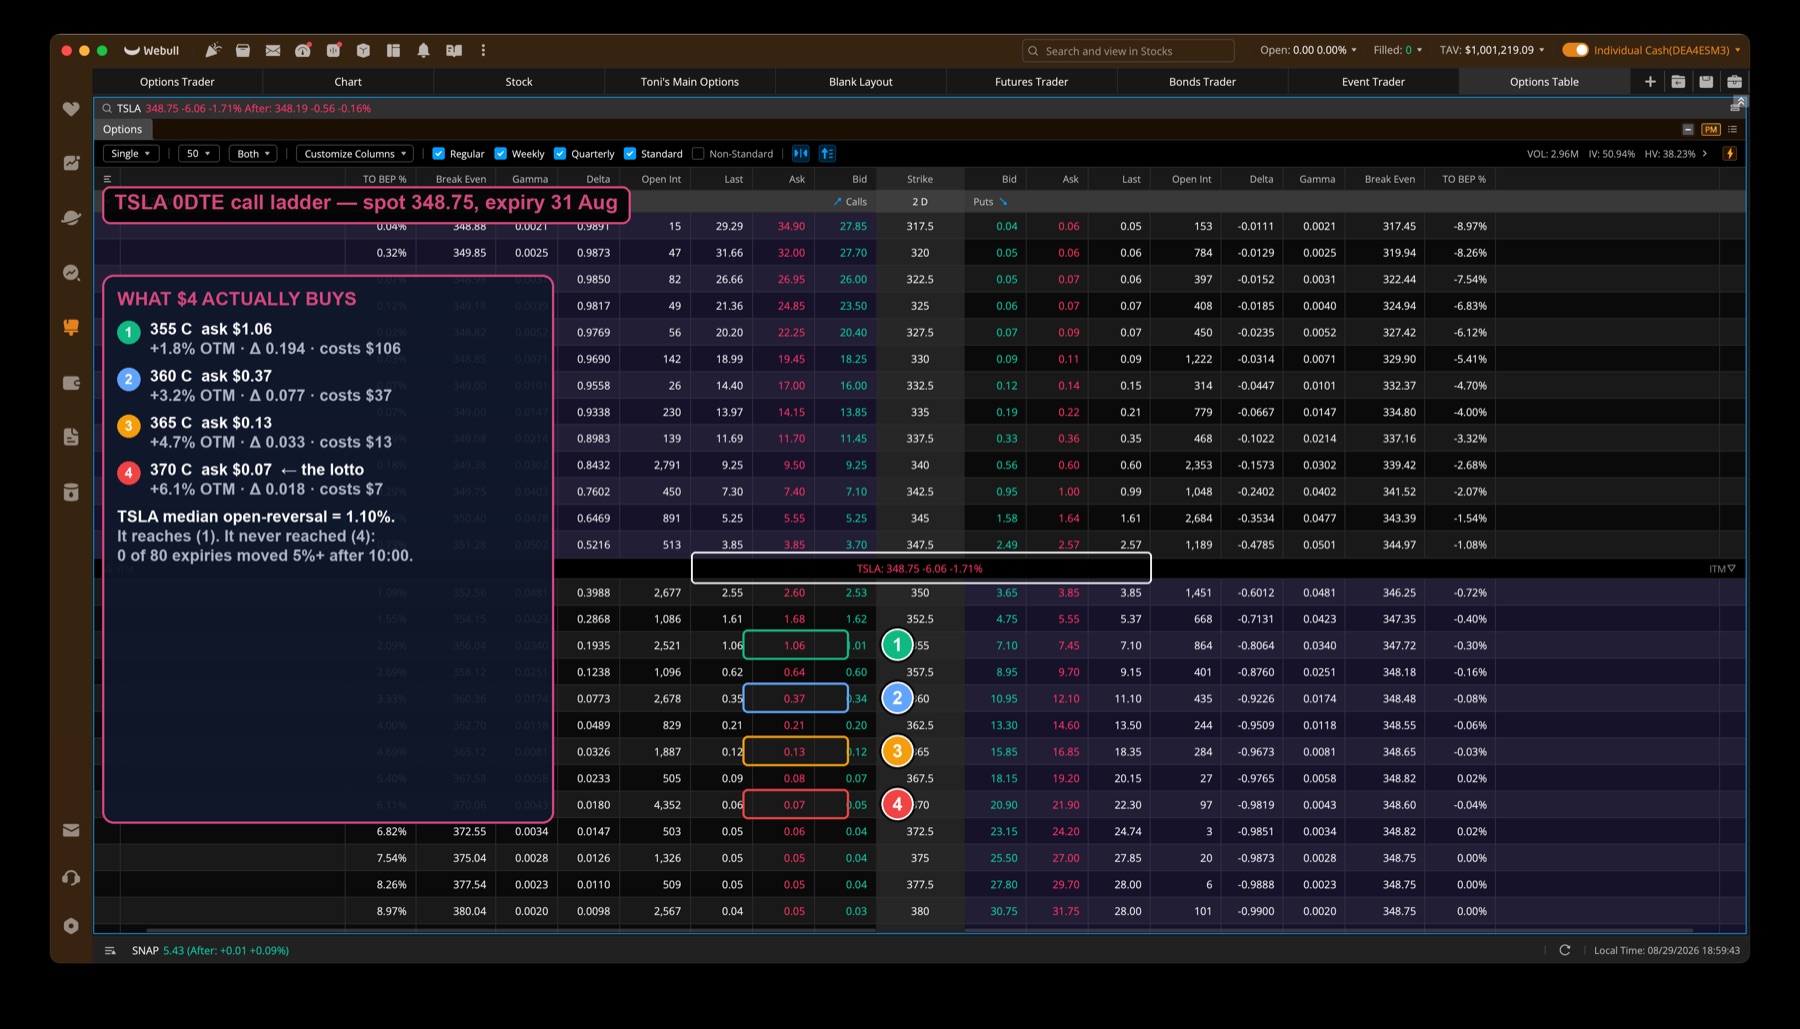
Delta is the tell. At TSLA 348.75 the 370 call asks $0.07 with delta 0.0180. Move the stock a full 1.5% — its typical open reversal — and that contract gains under two cents of directional value while the clock takes more than that back. The 355 call, one and a half percent away, carries delta 0.194: eleven times the sensitivity for a move that actually occurs.
Doesn't the contract reprice on delta expansion, even without finishing in the money?
Yes — and that is the only mechanism by which the far strike can pay at all. It is measured in the table below as the "sell at +60 min" column, which captures the contract's value an hour after entry rather than at expiry. Even on that generous basis the 5%+ bucket returned 0.65x per dollar risked: a 35% average loss per trade. Delta expansion is real; it just is not large enough, often enough, to cover the spread and the decay at that distance.
The Strike Distance Table That Decides the Trade
Same 80 days, same 10:00 trigger, but now every strike on the fade side is followed instead of only the cheap one. This is the centre of the whole article: expectancy falls monotonically as the strike moves further out.
| Strike distance | Observations | Median cost | Hit 3x | Held to expiry | Sold at +60 min |
|---|---|---|---|---|---|
| 0 – 0.5% | 58 | $242 | 20.7% | 0.85x | 0.94x |
| 0.5 – 1% | 62 | $172 | 22.6% | 0.80x | 1.03x |
| 1 – 1.5% | 60 | $114 | 23.3% | 1.09x | 1.05x |
| 1.5 – 2% | 59 | $84 | 16.9% | 0.50x | 0.86x |
| 2 – 3% | 127 | $41 | 20.5% | 0.83x | 1.05x |
| 3 – 4% | 120 | $20 | 16.7% | 0.37x | 0.85x |
| 4 – 5% | 126 | $10 | 13.5% | 0.13x | 0.76x |
| 5%+ (the lotto) | 485 | $4 | 7.2% | 0.00x | 0.65x |
Read the last two columns as dollars returned per dollar risked. Anything under 1.00 loses money. The lotto strike is the worst bucket in the table on every exit rule tested, and it is not close.
The Reversal Expires Before Your Contract Does
There is a second trap, and it costs more traders money than the strike choice. The reversal is a move, not a trend — and a 0DTE contract only pays if you leave before the move does.
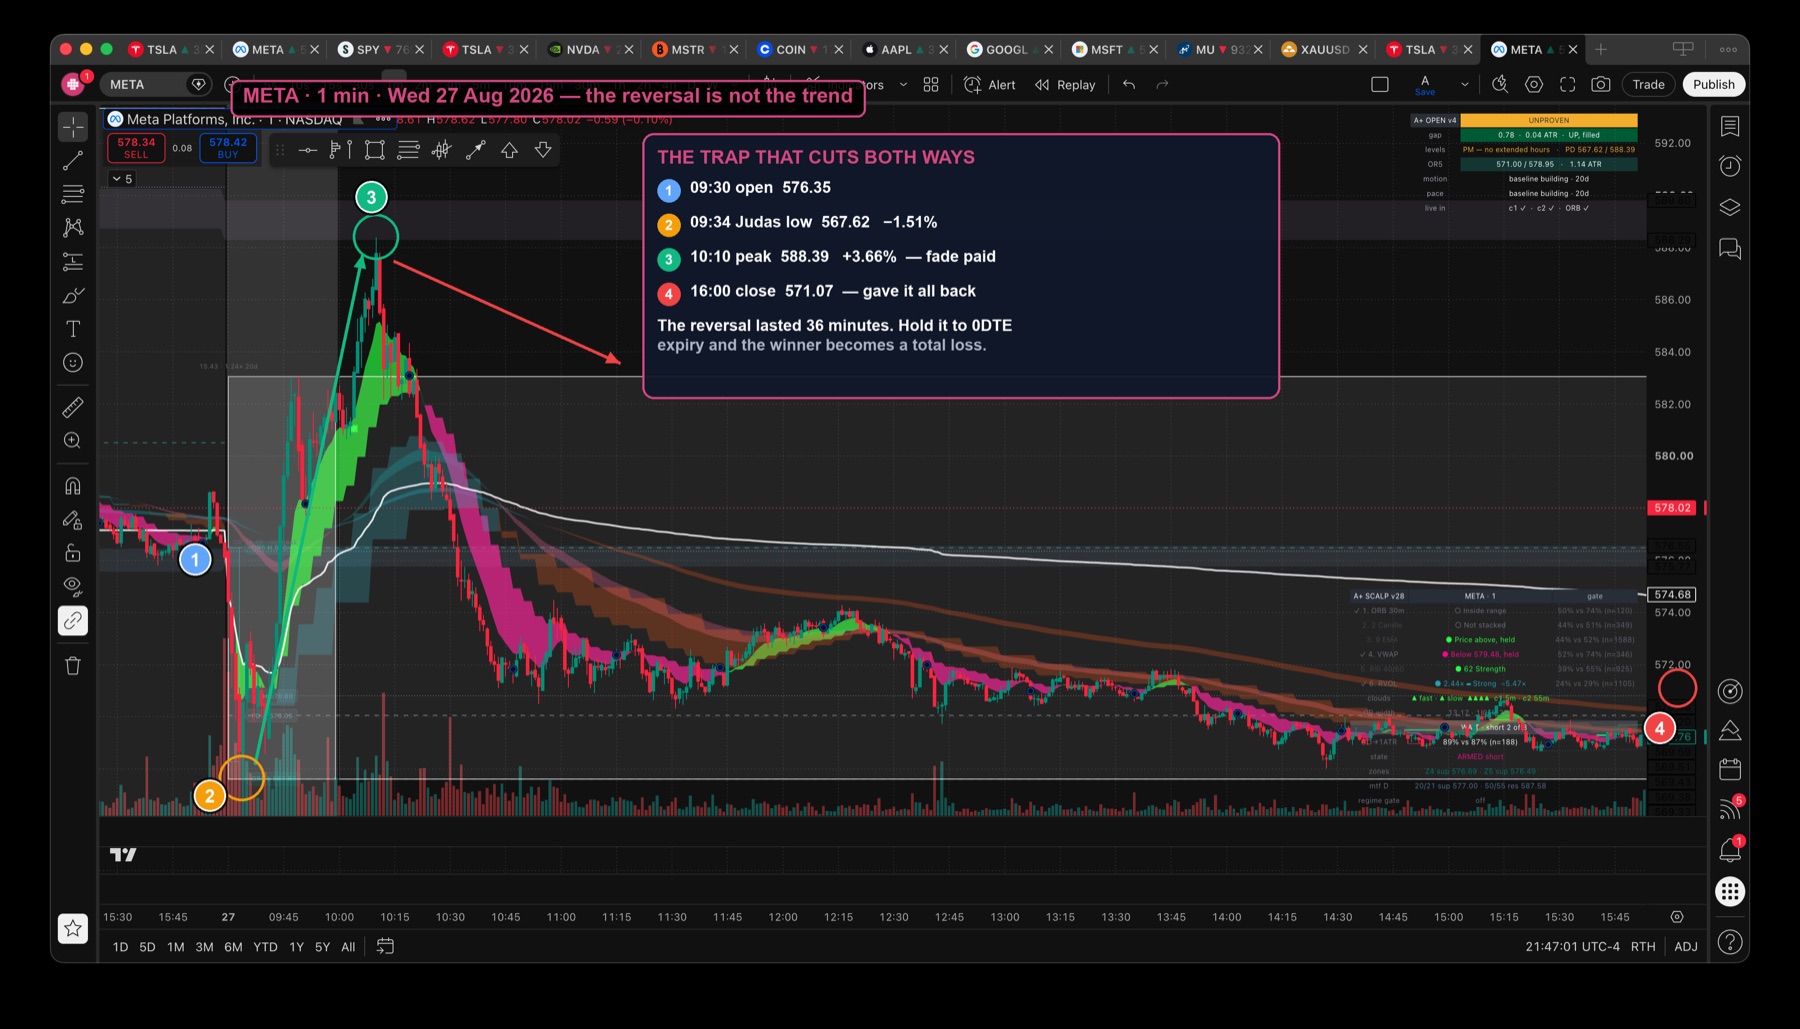
On 27 August META dipped to 567.62 at 09:34, reversed to 588.39 by 10:10, and then faded all day to close at 571.07. The reversal was correct, worked fast, and lasted 36 minutes. Anyone holding that contract for the "obvious trend" watched a winner become a total loss.
The data says the same thing less dramatically. The median contract in the study was worth only 0.41 to 0.61 of its entry price sixty minutes in — theta on an expiring option is brutal and it never pauses. The median session took 94 minutes from extreme to peak, which means the profitable window and the decay window overlap almost exactly.
| Hold to expiry | Sell at +60 minutes | |
|---|---|---|
| Rationale | "Let the winner run" | Exit with the move |
| 5%+ strike | 0.00x | 0.65x |
| 1-1.5% strike | 1.09x | 1.05x |
| What kills it | Theta and a move that already ended | Nothing — it is the better of the two |
What Actually Survives the Data
Strip out what failed and this is what is left standing.
- The opening extreme is a real, measurable event. 63.5% of sessions traded back through the 09:30 open. That is the foundation, and it holds.
- Size the expectation to the leg. Under 0.5% of opening range, there is no trade. Over 2%, the median reversal more than doubles to 2.57%.
- Buy where the move lands, not where the price tag is comfortable. That is 0.5% to 3% out of the money, costing $40 to $170 — not $4.
- Exit on the move, not on the expiry. Sixty minutes was the better rule in every bucket tested.
- Blind entry is still not an edge. Even at the best strike distance, mechanical entry at 10:00 returned roughly 1.00 to 1.05x. That is breakeven with commissions still to pay.
Point 5 matters most. The strike fix takes you from losing badly to roughly flat. To get past flat you need a filter, and one candidate showed up in the data: require price to have reclaimed the 09:30 open by 10:00 before entering — the reversal confirming itself rather than being anticipated. On those days every strike bucket returned at or above 1.00x and the 2x hit rate rose to around 60%.
Running This Without Lighting Money On Fire
If you want to trade the opening reversal, here is the process the data actually supports:
- Wait for 10:00 ET. The opening window has to finish before you can measure it. Entering at 09:35 means guessing which extreme is the trap.
- Measure the leg. Which side ran further from the 09:30 open, and by how much? Under 0.5% — stand down.
- Require the reclaim. Price back through the 09:30 open before you commit. This is the untested-but-promising filter; treat it as a discipline that keeps you out of trends, not as an edge you have proven.
- Pick the strike from the expected move, not the price tag. Median reversal for your leg bucket, rounded to the nearest strike. Usually 1% to 2% out.
- Size for a full loss. A 0DTE contract that does not work is worth zero, not "down 30%". Position accordingly — the margin mechanics of a leveraged loss do not care that the ticket was cheap.
- Set the exit before entry. Sixty minutes, or the move stalling, whichever comes first.
- Trade liquid underlyings only. Spreads eat marginal edges alive; the most liquid 0DTE scalping tickers exist for exactly this reason.
The Takeaway
Your read on the market is right and your read on the option is wrong. The opening reversal happens on nearly two thirds of sessions — but at a median of 1.55%, it lands nowhere near a strike that costs four cents.
Move the strike in to where the move actually goes, pay $40 instead of $4, and sell inside an hour. That converts a guaranteed donation into a coin flip — and a coin flip you can then try to bias with a filter. The $4 ticket cannot be fixed, because nothing was broken about its price.
Method and limits. Reversal statistics: 1,716 symbol-days, 13 US large caps, 132 sessions, 20 Feb – 28 Aug 2026, regular hours only, one-minute bars. Option statistics: TSLA only, 80 expiry days, 1,097 contract observations, entry at 10:00 ET, fill at the ask plus one cent, no commissions modelled. One ticker and one six-month regime is a narrow window — the direction of the strike-distance gradient is the durable finding here, not the decimal places. Nothing above is investment advice.