Edges
Breakout Scalp Entry: Price Action Leads, the Indicator Gates
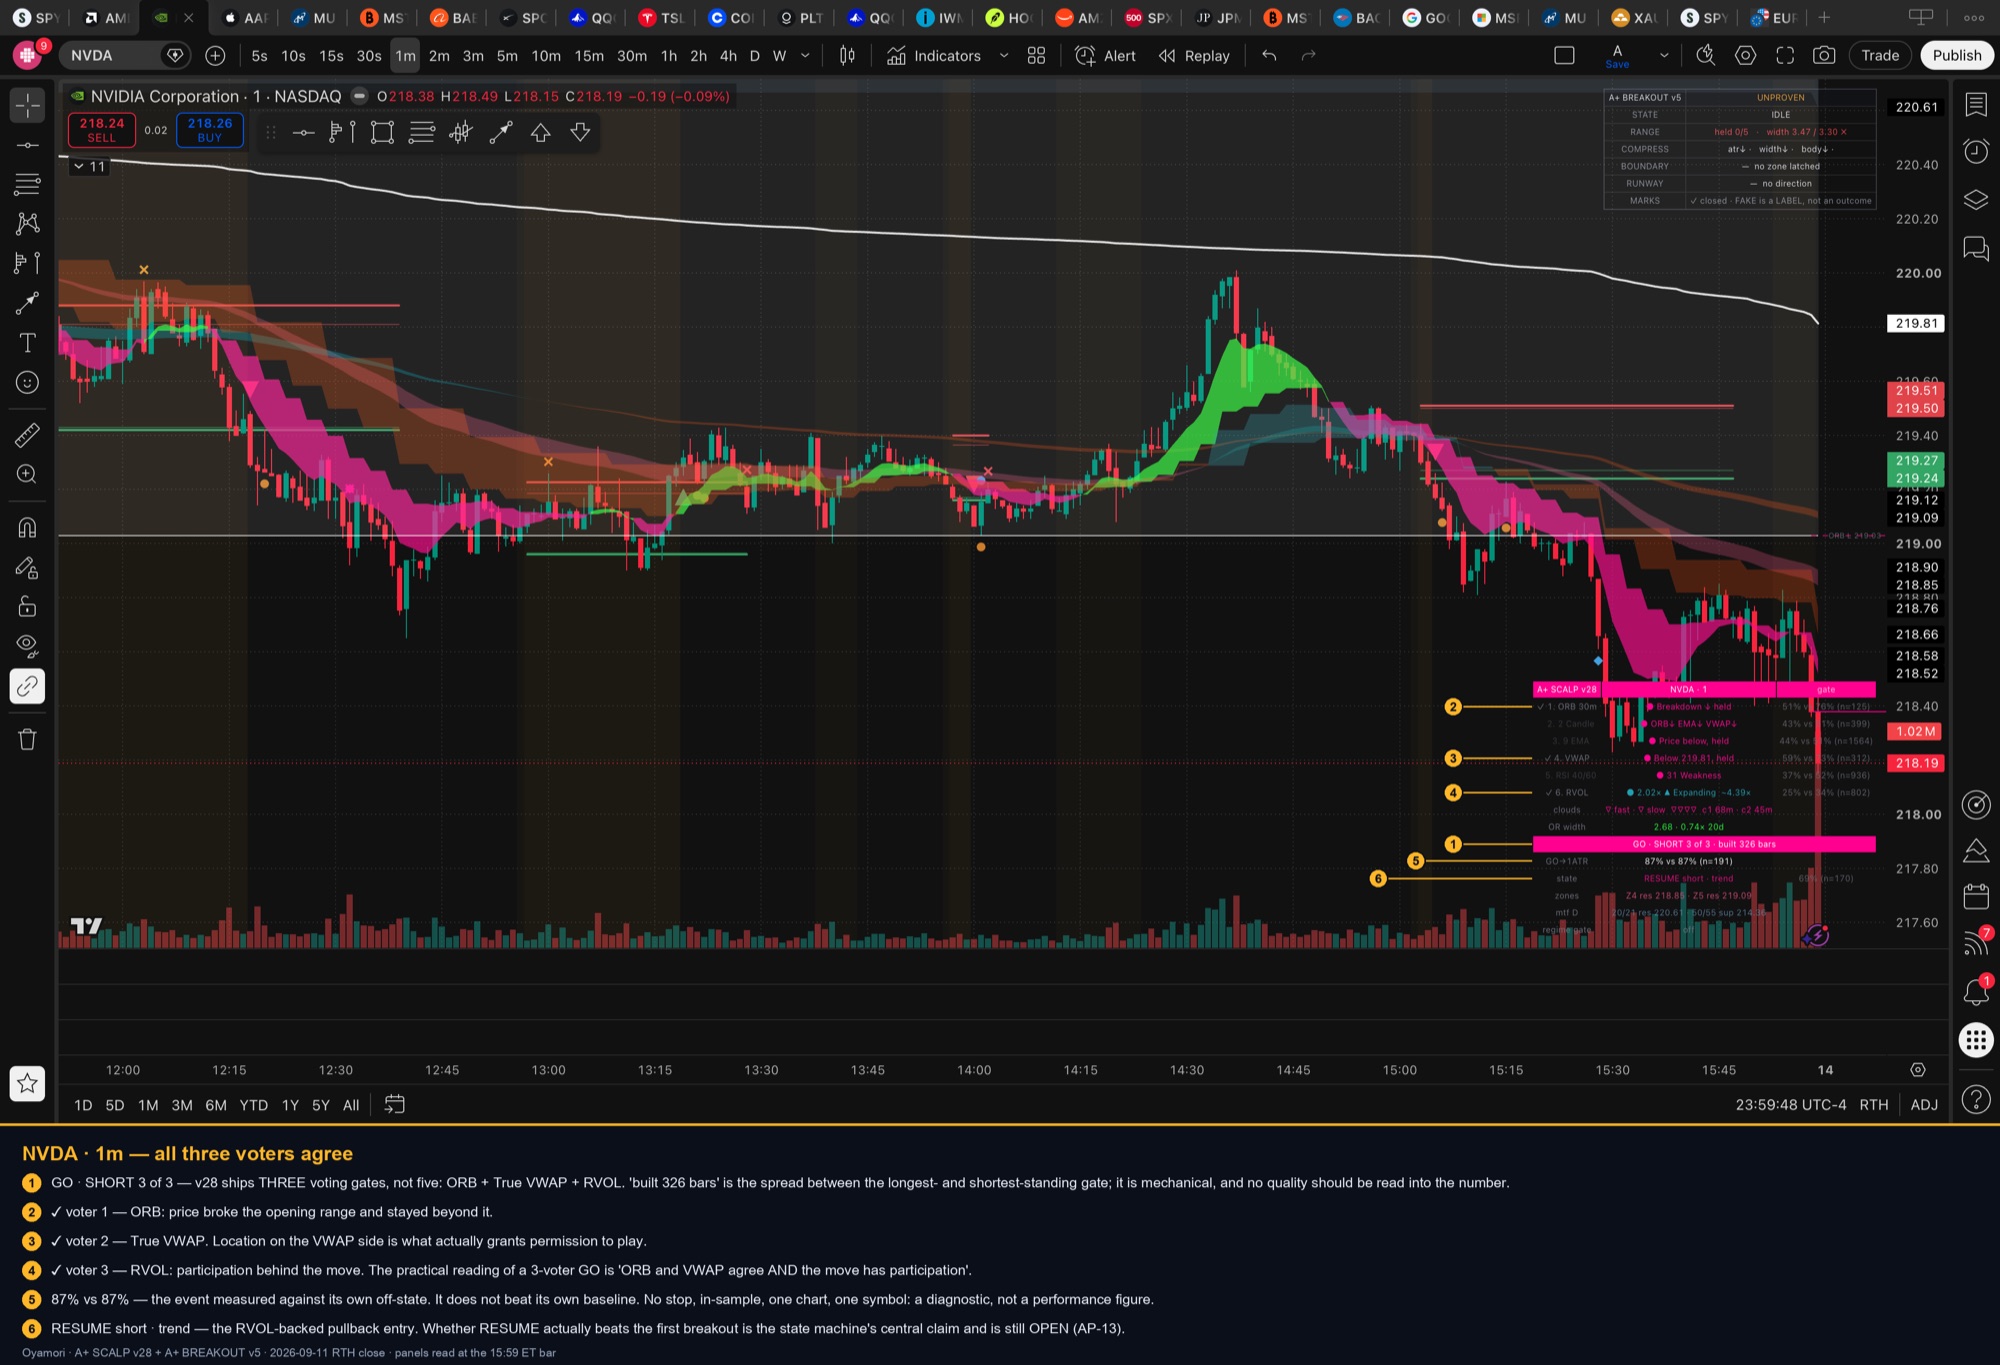
A breakout scalp entry lives or dies in about four seconds — the gap between seeing the candle close outside the range and clicking. Everything before that is analysis you can redo tomorrow. That four seconds is the trade.
This article is about handing those four seconds to a rule instead of a reflex, using two indicators as a gate rather than a signal source. It is also honest about what those indicators have and have not been measured to do, because the most useful thing we know about them is mostly what they fail to prove.
The order that matters: price action decides, the indicator times
The sequence is not negotiable, and the order is the whole method:
- Structure — is this breakout going with the dominant structure or against it?
- Compression — is there a balance to break out of?
- Displacement — did a candle actually close beyond the level, with intent?
- The gate — only now, does the indicator permit the click?
Run those in any other order and the indicator starts generating trades instead of filtering them. A cloud flip is a lagging derivative of price; a breakout is the event that caused it. If you let the derivative lead, you are always entering after the thing you claim to be trading.
What A+ Breakout actually draws — and what UNPROVEN means
A+ Breakout runs a small state machine over M1: IDLE → RANGE → ARMED → BREAK → RETEST → CONTINUE, with side-branches for SWEEP, FAKEOUT and DEEP. Three of its rules are worth stealing whatever software you use:
- ARMED freezes the zone. Boundaries are latched when the range arms and are never recomputed. A level that moves to follow price is not a level.
- ARMED is not an entry. The zone must be occupied for at least one bar before BREAK is even reachable.
- A break needs distance. Minimum penetration is 0.50 ATR beyond the outer boundary — a wick through the level is not a break.
The panel's own footer says the thing most breakout systems won't: "FAKE is a LABEL, not an outcome." A mark saying fakeout is a description of shape, not a claim about what happens next.
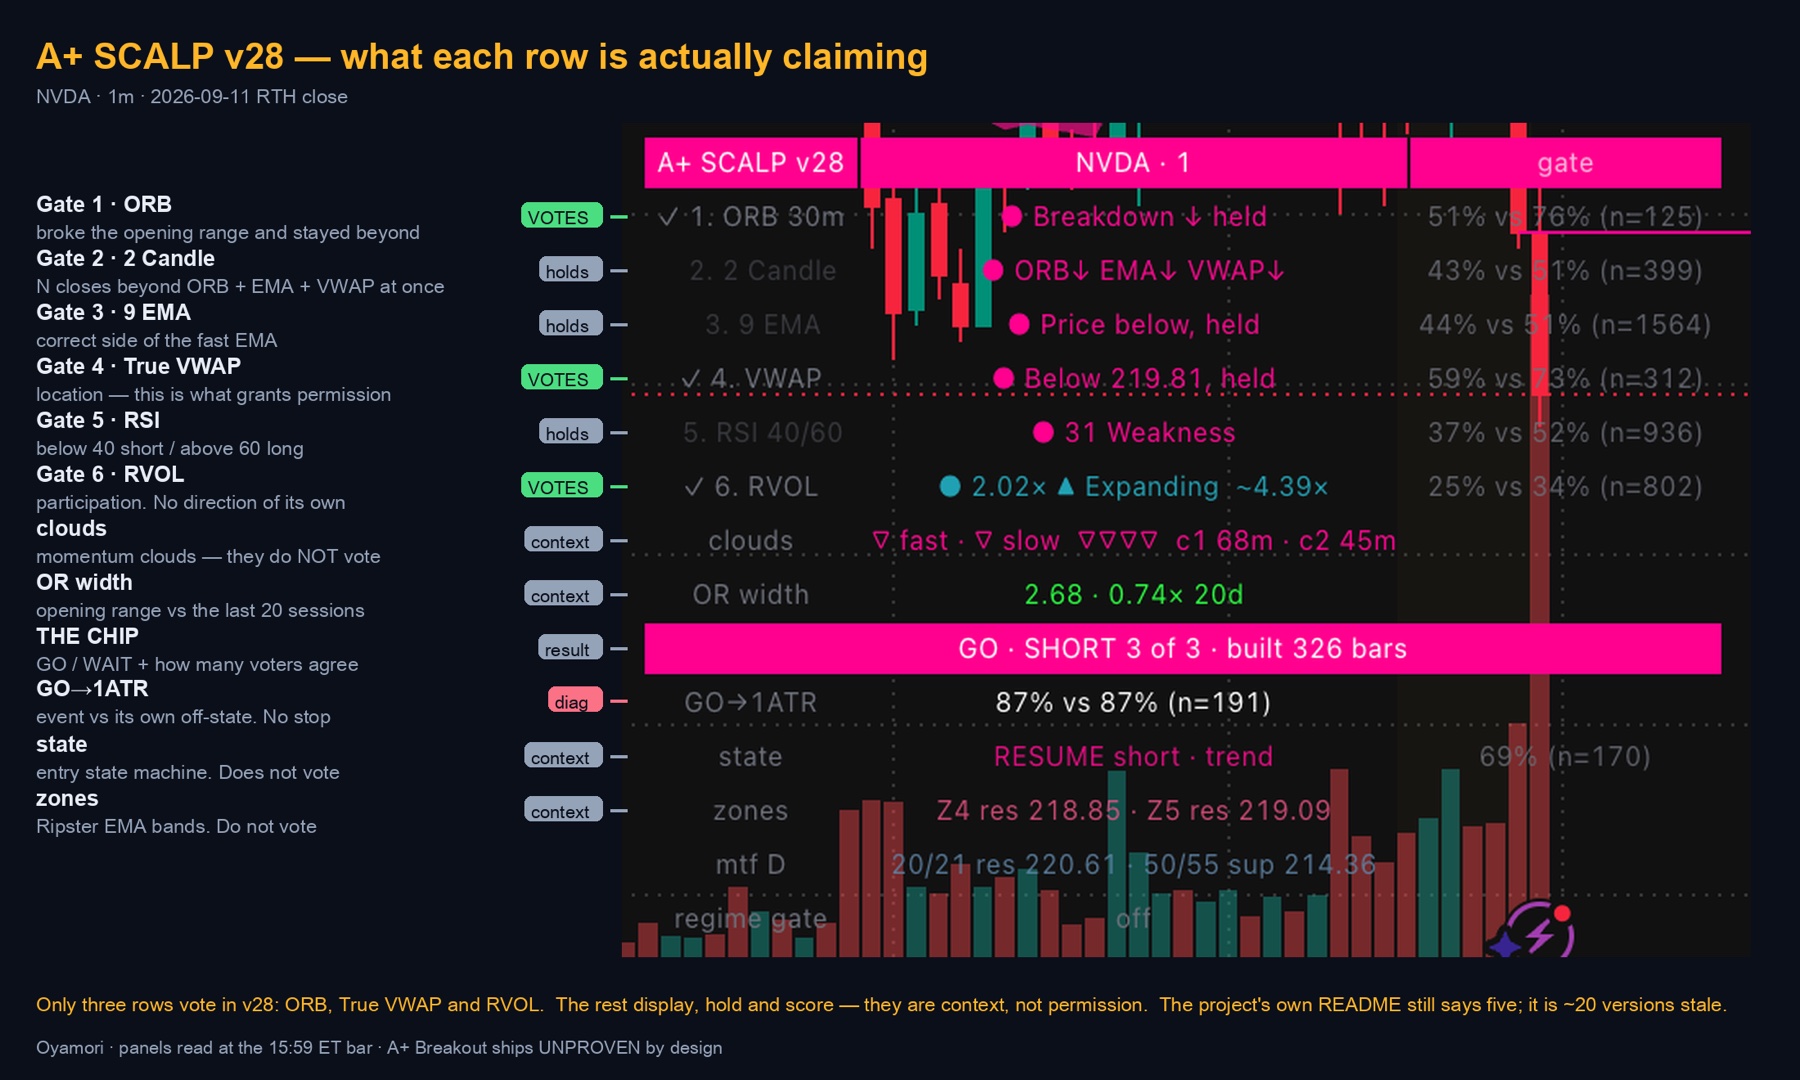
Reading the gate: two refusals and one permission
Three charts, same minute, same session close. Two say wait; one says go.
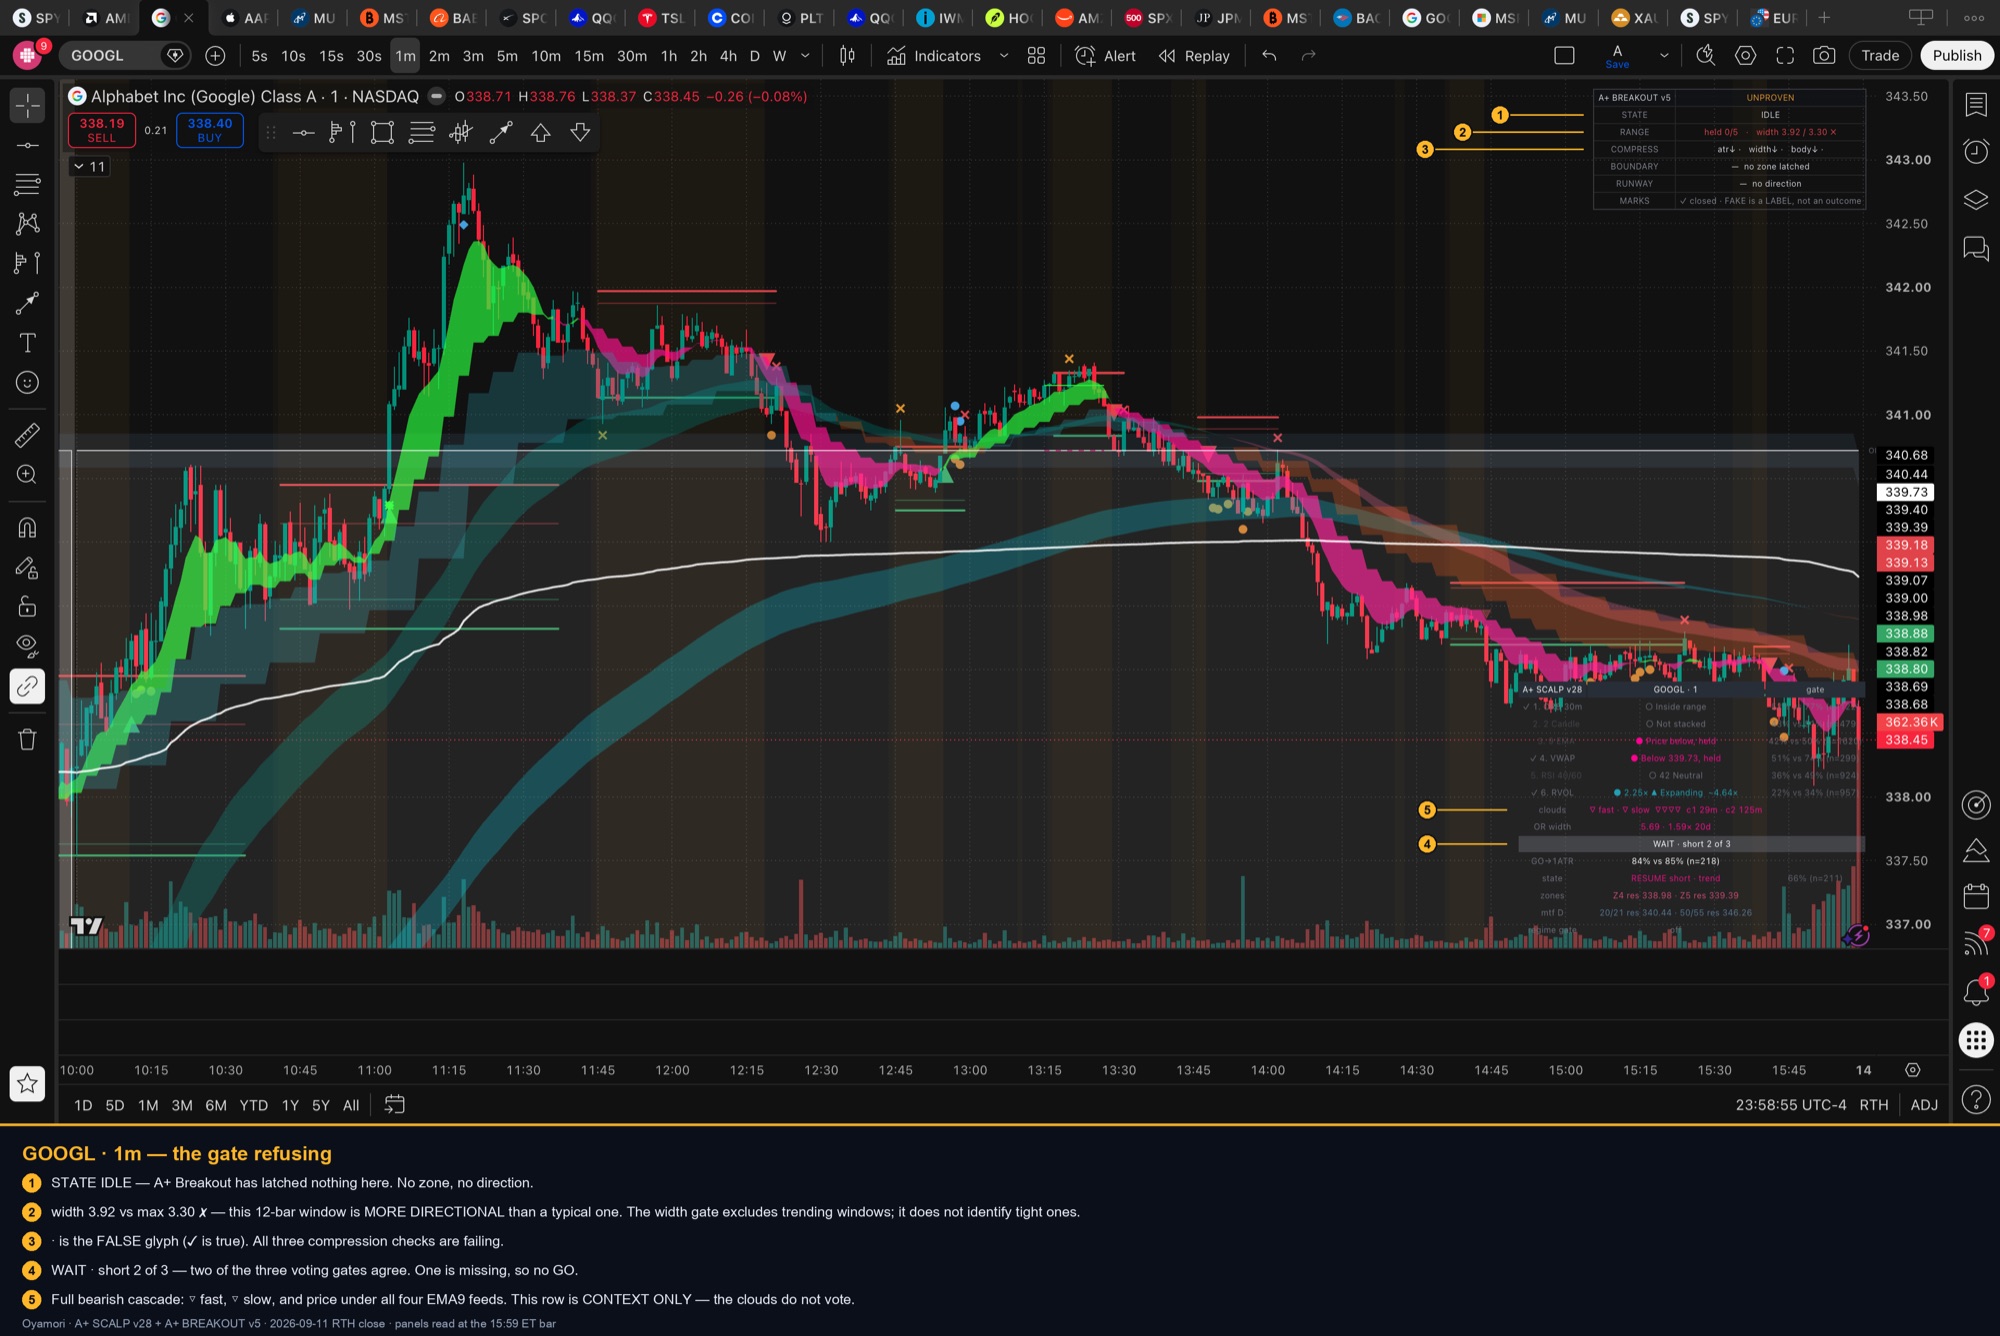
The row worth studying is RANGE: width 3.92 / 3.30 ✗. It is tempting to read that as "too wide to be a consolidation." It is not. The width test excludes trending windows; it does not identify tight ones — the ratio measures range per unit of volatility, and that sits near 3.3 whether a band is flat or drifting. The real compression evidence is the COMPRESS row, where · means false and ✓ means true.
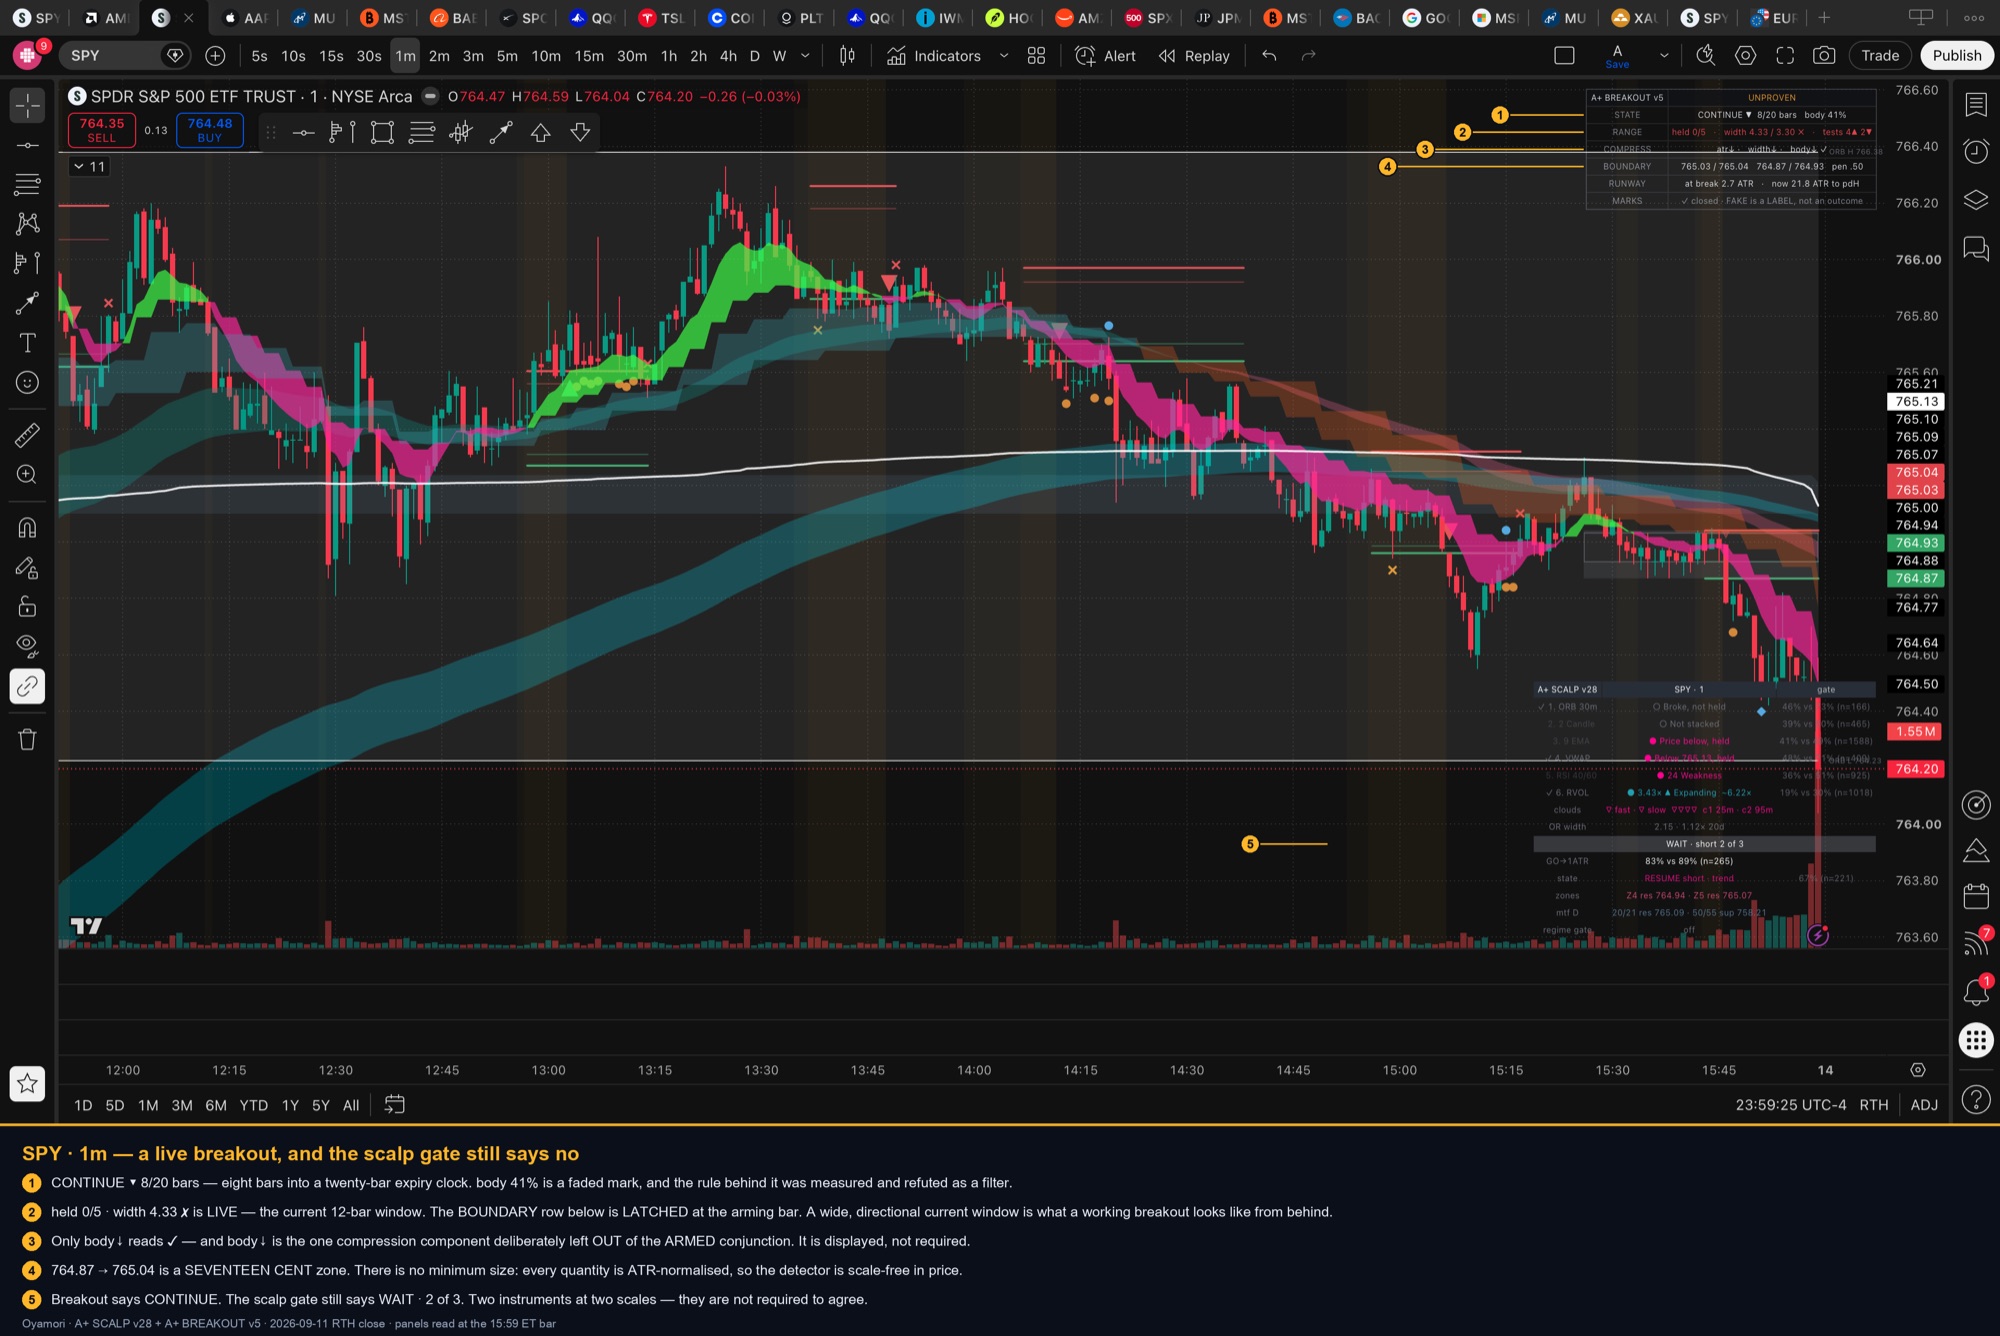
Two details here repay attention. The latched zone is 764.87 → 765.04 — seventeen cents. There is no minimum size anywhere in this tool; every quantity is ATR-normalised, so it is scale-free in price. And the live RANGE row reads wide while the state reads CONTINUE, which is not a contradiction: RANGE is the current window, BOUNDARY is frozen at the arming bar. A wide, directional current window is exactly what a working breakout looks like from behind.
There is a caveat the tool publishes about itself, and it is the most teachable thing in the whole dashboard. Gates 1, 3 and 4 all ask the same kind of question — which side of a level is price on — and intraday the opening range, the fast EMA and VWAP cluster and flip almost together. So a chip reading "all gates agree" can be closer to two independent confirmations than to five. That is why the panel prints a build spread: built 326 bars versus snapped. A setup where every gate flipped inside one bar is fragile, and burying that inside a count would hide it.
The resolution gap: why your eyes still have a job
Here is where price action does something the indicator structurally cannot.
A+ Breakout measures a 12-bar window and requires the width test to hold for 5 consecutive closed bars. That means the compression must span roughly 16 bars of M1 before a zone can latch. A three-to-eight bar consolidation — the tight little shelf that forms after an impulse and offers the best entry — is below its resolution. The 12-bar window still contains most of the preceding move, so the ratio reads high and the hold counter never starts.
That is a resolution limit, not a size limit. The seventeen-cent SPY zone proves size was never the constraint.
Drag the window and the trap becomes obvious. At three bars, 97–99% of every window in the session sits under the 3.30 threshold — a filter that admits almost everything is not a filter. At twenty bars, only 10–18% do. The threshold is calibrated for twelve, where it sits almost exactly on the median.
Measured on one full RTH session across NVDA, SPY and GOOGL, the median 12-bar range ÷ ATR14 came out at 3.32, 3.38 and 3.21. The project's own calibration across 75 symbol-days puts that median at 3.29. The number is stable — which is exactly why it cannot also be sensitive to a five-bar shelf.
So the division of labour is: the indicator finds balance at a 16-bar scale; you find it at a 4-bar scale. Two lenses, different focal lengths. Neither is a correction of the other.
What the clouds actually do
The momentum clouds are one EMA length — 9 — sampled at four timeframes: 1m, 3m, 5m and 10m. Cloud 1 (1m vs 3m) is the turn. Cloud 2 (5m vs 10m) is the trend.
Three things most descriptions get wrong:
| The common belief | How it is built | |
|---|---|---|
| Rule | fast EMA above slow EMA | 0.03 x ATR deadband, side held inside it |
| Feeds | continuous EMAs | reseeded at each session open |
| Slow cloud | permission to trade | annotates, does NOT gate |
| Reading | cross means go | a cross inside the band is not a flip |
The deadband is not cosmetic. A slower feed on a 1m chart is a staircase — the 3m edge is parked for three bars at a time — so a bare greater-than comparison flips on a graze and flips straight back. And waiting for the slow cloud before every entry is precisely the lateness that row exists to reveal. Location on the VWAP side is what grants permission, not the slow cloud.
The three entries, and the ranking nobody has earned
There are three defensible entries after a confirmed break:
- Breakout close — fastest, most fakeout exposure.
- Micro pullback — a shallow retrace that does not close back inside the range.
- Full retest — most precise, and in a strong move it frequently never comes.
The micro pullback has a name in the state machine: PULLBACK → RESUME. Its definition is stricter than it looks — a 0.3 ATR retrace and fading RVOL. The tooltip is the lesson: "price easing back on steady volume is a stall, not a pullback." If it hasn't resumed within 12 bars, the impulse failed.
Invalidation is one rule, and it is refreshingly short: lose the VWAP side, or have cloud 1 turn against you. Add "closes back inside the broken range" from price action and you have the whole exit-before-target logic. Your stop belongs behind the breakout structure, not below the entry candle.
What is actually measured — and what is not
This is the section most indicator write-ups skip. Ours exists because the numbers are unflattering and useful.
Read those together and the discipline becomes clear. The fast cloud's flip, measured with a real stop over 2,082 samples, produced +0.007R ± 0.061. That interval contains zero — the honest statement is no measurable edge, not a losing signal.
More importantly, look at the persistence row. Random entries with no stop touch 1 ATR 47% of the time within 5 bars and 78% within 40. Almost any hit rate an intraday dashboard displays sits inside that band, which means a bare percentage tells you nothing unless you also know what a coin flip scores on the same rule.
Why do the on-panel percentages not prove anything?
Each cell shows the event against its own off-state — the same measurement taken while the signal was already up. That is a good control design. But the tracker has no stop, so a sample ends when the setup stops holding, and the figure is dominated by how long that takes.
On the three charts in this article the readings were 87% vs 87%, 83% vs 89% and 84% vs 85%. The event does not beat its own baseline on any of them, and on one it is six points worse. That is the correct thing to notice — not the size of the number.
It is also in-sample, one chart, one symbol, one timeframe. It is a diagnostic for whether a setup is behaving, not a backtest and not a forward-looking claim.
The most instructive failure in the project's history is a measurement one. A filter scored itself for nine versions and reported passing setups winning 76% against blocked ones at 25%. Rebuilt on the same bars with a real stop, those became 31% and 32% — no separation at all. The exit condition had quietly been the filter condition, so blocked trades died faster by construction. A fake breakout is not something you need to classify in advance; it is something your invalidation rule handles. The same is true of most filters that look brilliant until you make them survive a stop.
The takeaway
Use price action to decide what to trade and the indicator to decide when — never the reverse. Read balance at a four-bar scale with your eyes, because the tool cannot resolve anything finer than sixteen. Let VWAP location grant permission and treat the slow cloud as commentary. Invalidate on the VWAP side or a cloud-1 turn, and put the stop behind structure.
And hold every number you see — ours included — against what a random entry scores on the same rule. If you would like the layer-by-layer version of this as a pre-click routine, the scalp entry checklist covers the full stack, and multi-timeframe entry covers picking the right moment inside a larger structure.
Reaction zones and multi-timeframe cloud bands shown in the charts derive from Ripster EMA Clouds and Ripster MTF Clouds by ripster47, used under MPL-2.0. Panels captured at the 2026-09-11 RTH close.