Edges
Scalp Entry Checklist: Eight Layers Before You Click
A scalp entry checklist exists for one reason: on a one-minute chart every individual signal is true and almost none of them are sufficient. A red candle is true. A change of character is true. A cloud being pierced is true. Traded alone, each of them produces the same trade — early, into support, against a regime that never changed.
What follows is the eight-layer sequence we use before a scalp entry, worked against a real losing entry on TSLA where the signal was genuine and the trade still had no business being taken.
The anatomy of a premature entry
Here is the entry, marked with the yellow arrow, on the one-minute chart:
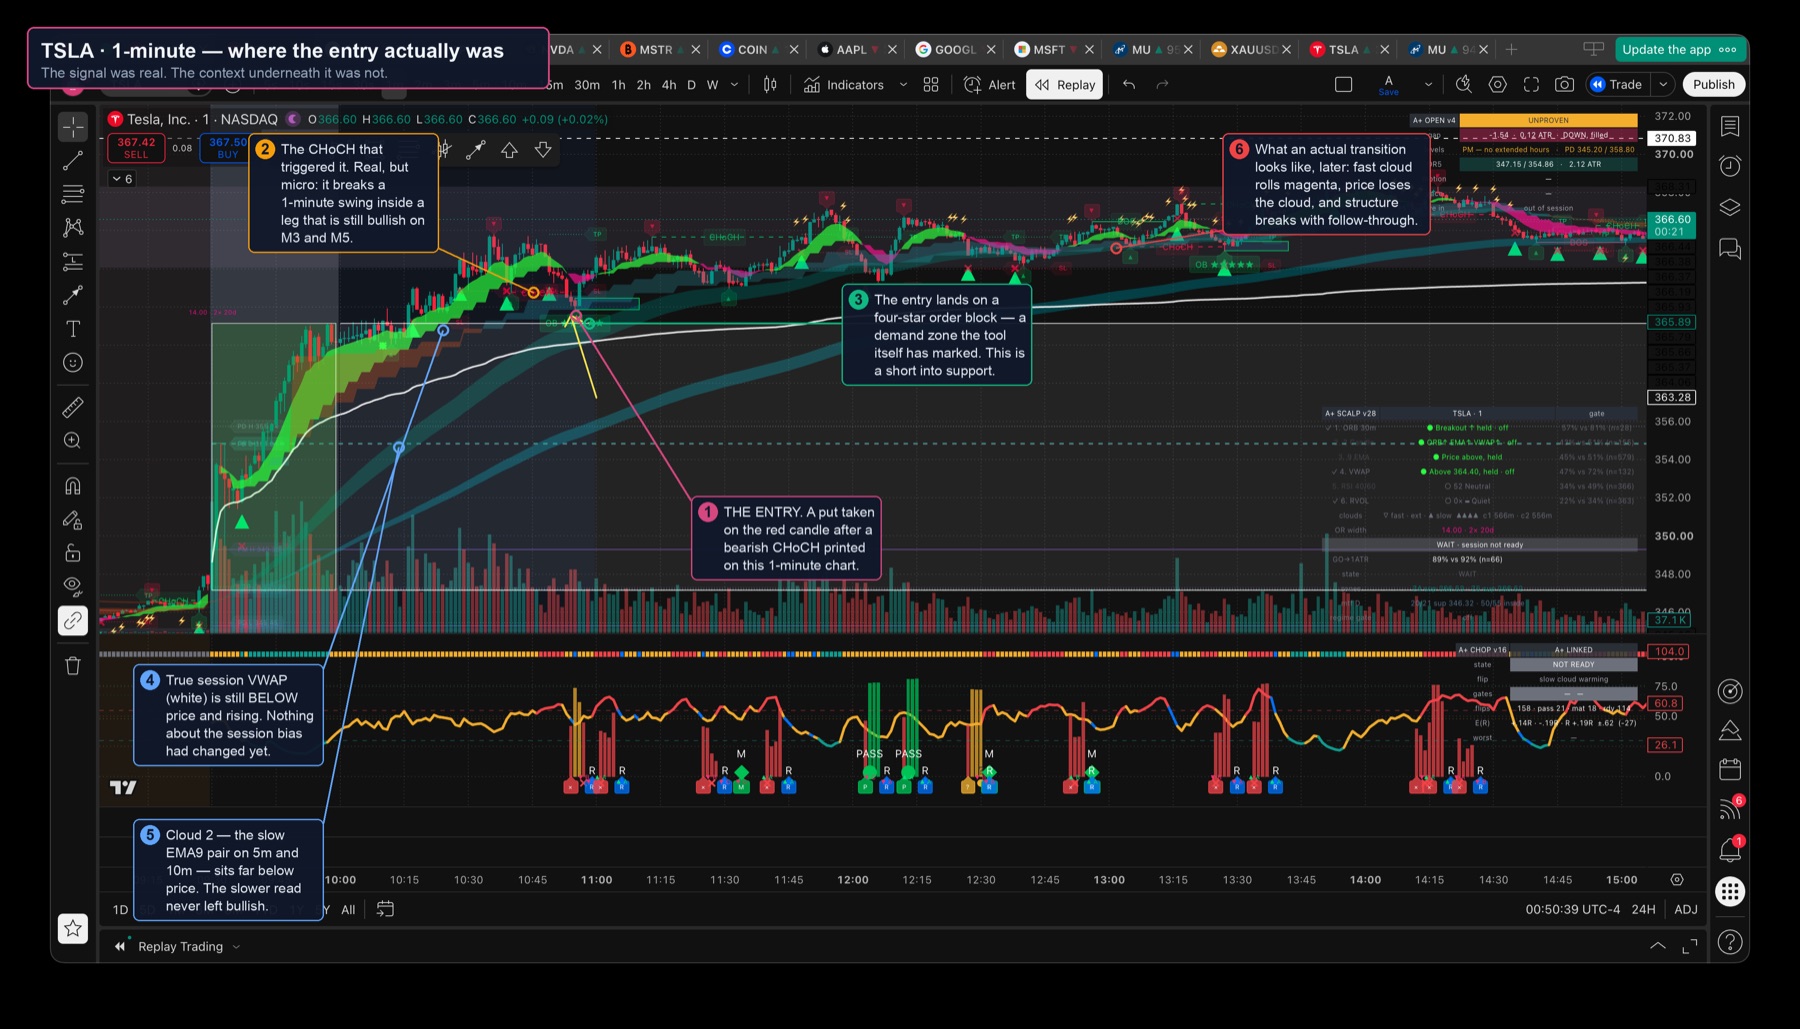
The reasoning behind it was not lazy. The trader did not short because a red candle appeared. A bearish change of character — a CHoCH — printed first, breaking the previous micro higher-low. Sellers then produced a continuation candle, and the put was bought on it.
Every one of those observations is correct. The trade still lost everything, and the checklist explains why in one line: the CHoCH was real, and it was micro.
Short a level and you need that level to break. Short into a level and you need it to hold — for the other side. This entry was aimed directly at a support stack: the order block, the previous structure, and the true session VWAP all sat underneath it.
Layer 1 — Regime: is the market on your side at all?
Before any call-or-put question, classify the environment. Three things vote: where price is relative to session VWAP, what the fast cloud is doing, and what the slow cloud is doing.
if price > VWAP and fast cloud up and slow cloud up:   regime = BULLISH
if price < VWAP and fast cloud down and slow cloud down: regime = BEARISH
otherwise:                                              regime = TRANSITION
A clean bullish stack reads, top to bottom: price · fast cloud · slow cloud · VWAP. In that arrangement the default idea is a pullback long, not a reversal short. The bearish stack is the mirror. Anything else is a transition, and transitions are where most bad scalps are born because every signal in them looks like the start of something.
The clouds are two EMA9 pairs read across timeframes: the fast cloud is EMA9 on 1-minute against EMA9 on 3-minute, the slow cloud is EMA9 on 5-minute against EMA9 on 10-minute. Both are session-fed and reseeded at the regular open, so a gap does not poison the average, and the side only changes when one edge clears the other by 0.03 ATR — a deadband that exists because a moving line grazing a parked one is not a turn.
So use VWAP the way it is used above — as a **location and a bias check**, the line that tells you which trade is with the session and which is against it — and not as a filter you expect to add expectancy. The refutation is written up in full in [why filter-hunting stops paying](/learning/options-spread-cost-in-r/).
Layer 2 — Location: more important than any candle
Location beats pattern. Before entering, name what price is standing next to: session VWAP, the fast or slow cloud, the opening-range edges, the previous day's high and low, an order block, a fair value gap, an obvious pool of stops.
Then apply the rule that costs traders the most money when they ignore it:
Entering *from* a level is a trade. Entering *into* one is a bet that the level will not do the thing it is drawn for. On the TSLA entry the sequence downward was: entry → order block → previous structure → session VWAP. Three supports stacked below the position, none of them broken.
Location also decides whether there is a trade at all. If the nearest opposing level is a few ticks away, there is no room to pay for the spread, and what your option round trip actually costs in R is the number that settles that argument.
Layer 3 — Structure: not every CHoCH weighs the same
This is the layer the TSLA trade got wrong, and it is the most useful idea in the whole checklist. A change of character means the structure at that resolution changed. It does not mean the trend changed.
Give every structure event a rank:
| Event | What it actually means |
|---|---|
| Micro CHoCH (sub-minute swings) | Warning. Something is weakening |
| 1-minute CHoCH | Transition candidate |
| 3-minute structure break | Strong reversal evidence |
| 5-minute-plus structure shift | Regime-level confirmation |
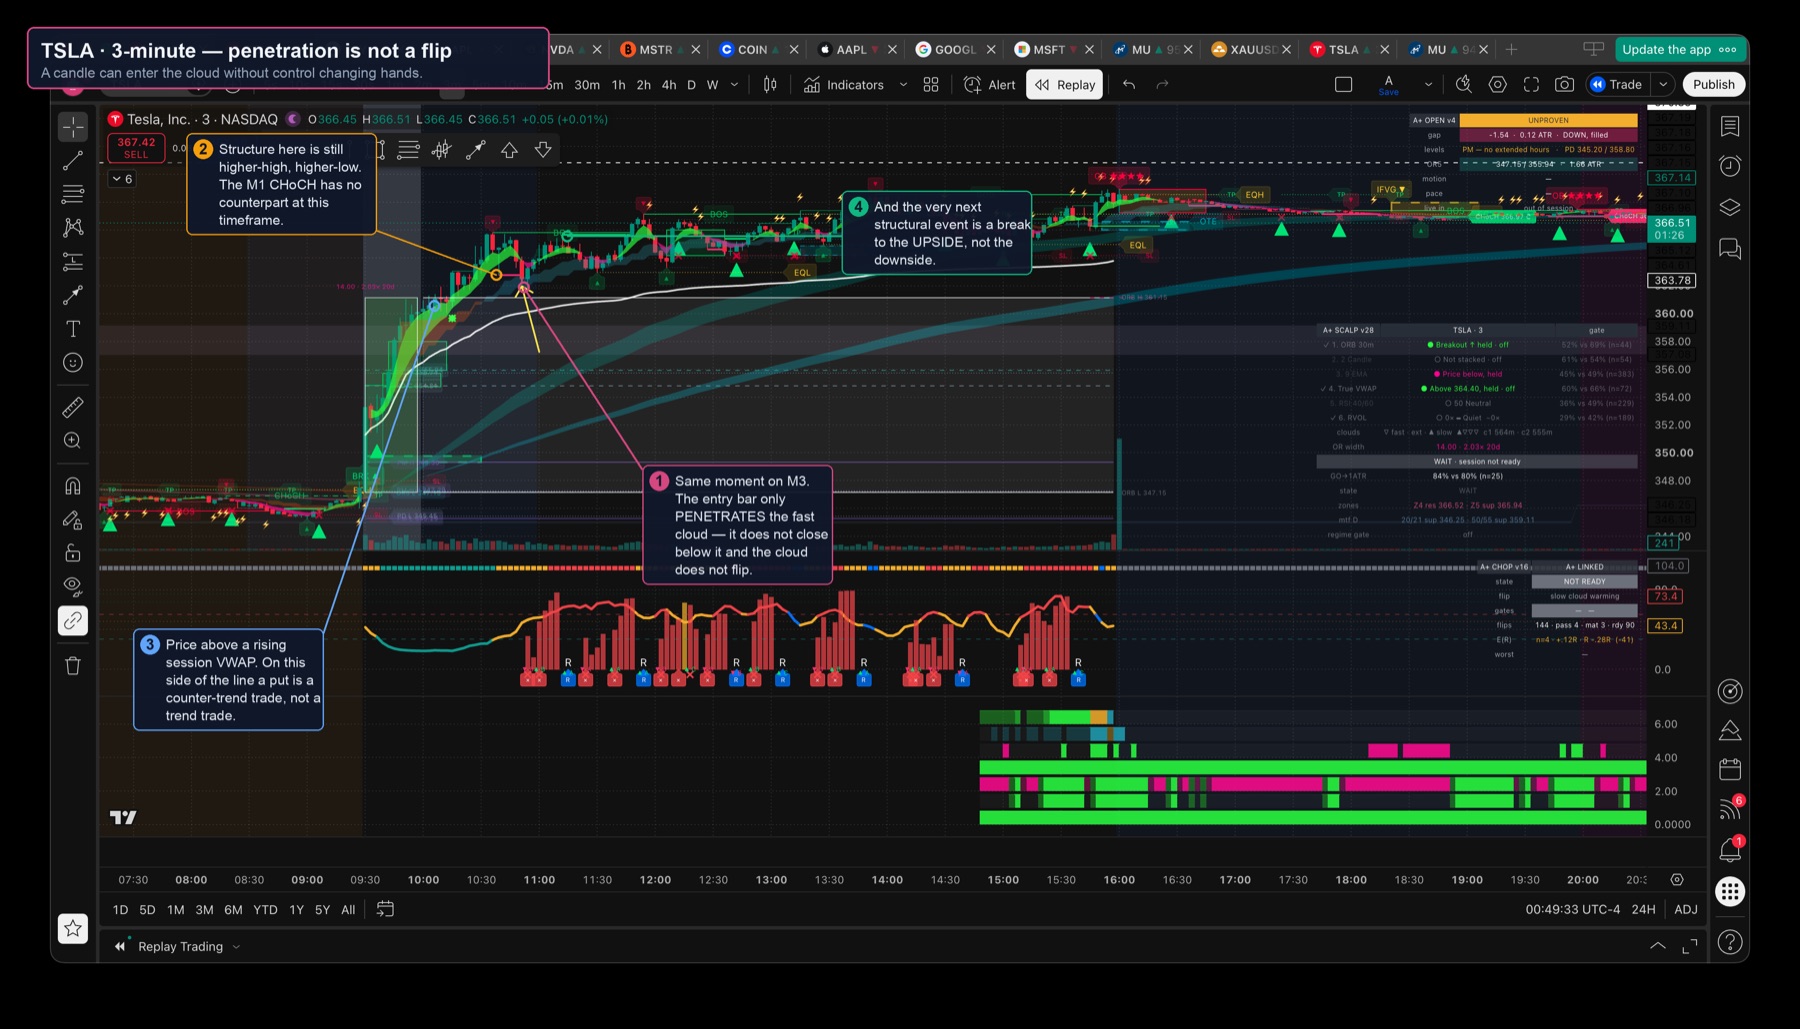
A bearish reversal that deserves size is not one event, it is a chain: break the higher-low → CHoCH → failed reclaim → lower high → lower low. The TSLA entry took the first link and treated it as the whole chain. Our guide to multi-timeframe entry alignment covers why the timeframe a break prints on is its weight.
Layer 4 — Cloud state: penetration is not a flip
The fast cloud is short-term order flow; the slow cloud is regime. What matters is knowing which of four things you are looking at, because they are not the same event and traders treat them as one:
candle pierces the cloud            → a test
closes against it, edges compress   → weakening
the cloud pair actually crosses     → FLIP
retest of the flipped cloud fails   → confirmed
A wick through a cloud is a test. Price can test a cloud repeatedly inside an intact trend — that is what a pullback is. Only the crossing changes who is in control, and only the failed retest proves it.
On the three-minute chart above, the entry bar produced a test. It was traded as if it were confirmed, which is three stages early.
Layer 5 — Liquidity: who got taken out before you got in
The strongest scalp reversals are not "CHoCH then enter." They have a specific architecture, and the order matters:
A sweep gives the move fuel — someone else's stops. Displacement proves intent. The retrace gives you a price worth paying, and the rejection at that price is the evidence. Skip the sweep and you are usually entering at the worst price of the sequence; our piece on liquidity sweeps and stop hunts covers why the range edges hold the information.
Layer 6 — Trigger: the candle tells you when, never why
Candlesticks are triggers, not context. The same bearish engulfing bar is an excellent signal at swept resistance inside a bearish regime and a coin flip in the middle of a range.
if bearish engulfing
   at resistance
   after a liquidity sweep
   with a structure break behind it:   strong
else:                                  noise
Volume is the second half of the trigger. In a healthy continuation the pattern is rhythmic: impulse expands, pullback contracts, continuation expands again. A pullback arriving on unusually heavy volume is the warning that this is not a pullback at all.
The eight-layer checklist, interactive
Tick what is genuinely true on your chart. The four required layers are the gate; the rest separate an ordinary entry from your best one. Switch to PUT with a bullish regime and it will refuse — deliberately.
The state ladder — why "CHoCH → enter" is the bug
Most premature entries come from a missing intermediate state. The market does not go from bullish to bearish; it goes through weakening first, and a checklist that has no word for weakening will call it bearish.
Written as rules:
bearish CHoCH                     → WARNING       (not a trade)
+ fast cloud weakening            → ARMED
+ cloud flip and acceptance below → TRANSITION
+ failed reclaim / lower high     → TRIGGER
The TSLA put was taken at WARNING. Nothing about the read was stupid — it was simply three states early, and on a same-day option, three states early is indistinguishable from wrong.
The counter-trend exception
Sometimes the reversal genuinely starts before the regime turns, and a rule that says "never fade" would miss the best entries of the day. So the rule is not a ban, it is a higher bar. When you want a put while the regime is bullish, require all of:
| Normal, with-trend entry | Counter-trend entry | |
|---|---|---|
| Regime | agrees with the direction | disagrees — you are fading it |
| Structure | agrees on the timeframe above | — |
| Location | entering from a level | — |
| Trigger | candle at that level | — |
| Bar to clear | four required layers | everything above, no exceptions |
| Also required | — | failed reclaim / lower high |
Being above a rising VWAP does not forbid a put — it downgrades it to a counter-trend reversal attempt requiring extra confirmation. That is a materially different sentence from "no puts above VWAP", and it is the honest one.
No-trade conditions
Knowing when there is no trade is worth as much as any entry rule, because chop is where a checklist gets used as a search for permission rather than a filter.
- both clouds are flat and tangled together
- price is crossing session VWAP repeatedly in both directions
- micro CHoCH is firing in both directions within a few bars
- structure is unreadable at your entry resolution
- the only available entry is directly into support or resistance
None of these become tradeable by finding more confirmations inside them. More signals inside noise is more noise.
The flip is late by construction — ask how much is already gone
An EMA9 on 3-minute crossing an EMA9 on 1-minute is roughly a 9-against-27 cross. Detecting a turn well after the low is exactly what such a cross does, and no amount of threshold tuning recovers those minutes.
Reconstructed on a real NFLX turn: price bottomed at 10:57 and the cloud flipped at 11:11 — fourteen minutes and about 1.1 ATR later.
Measure the distance from the last swing extreme to your entry, in ATR, before you click. None of the usual gates measures this — and efficiency-style filters actively reward it, because a long clean run into the flip scores well.
What the indicator panel can and cannot tell you
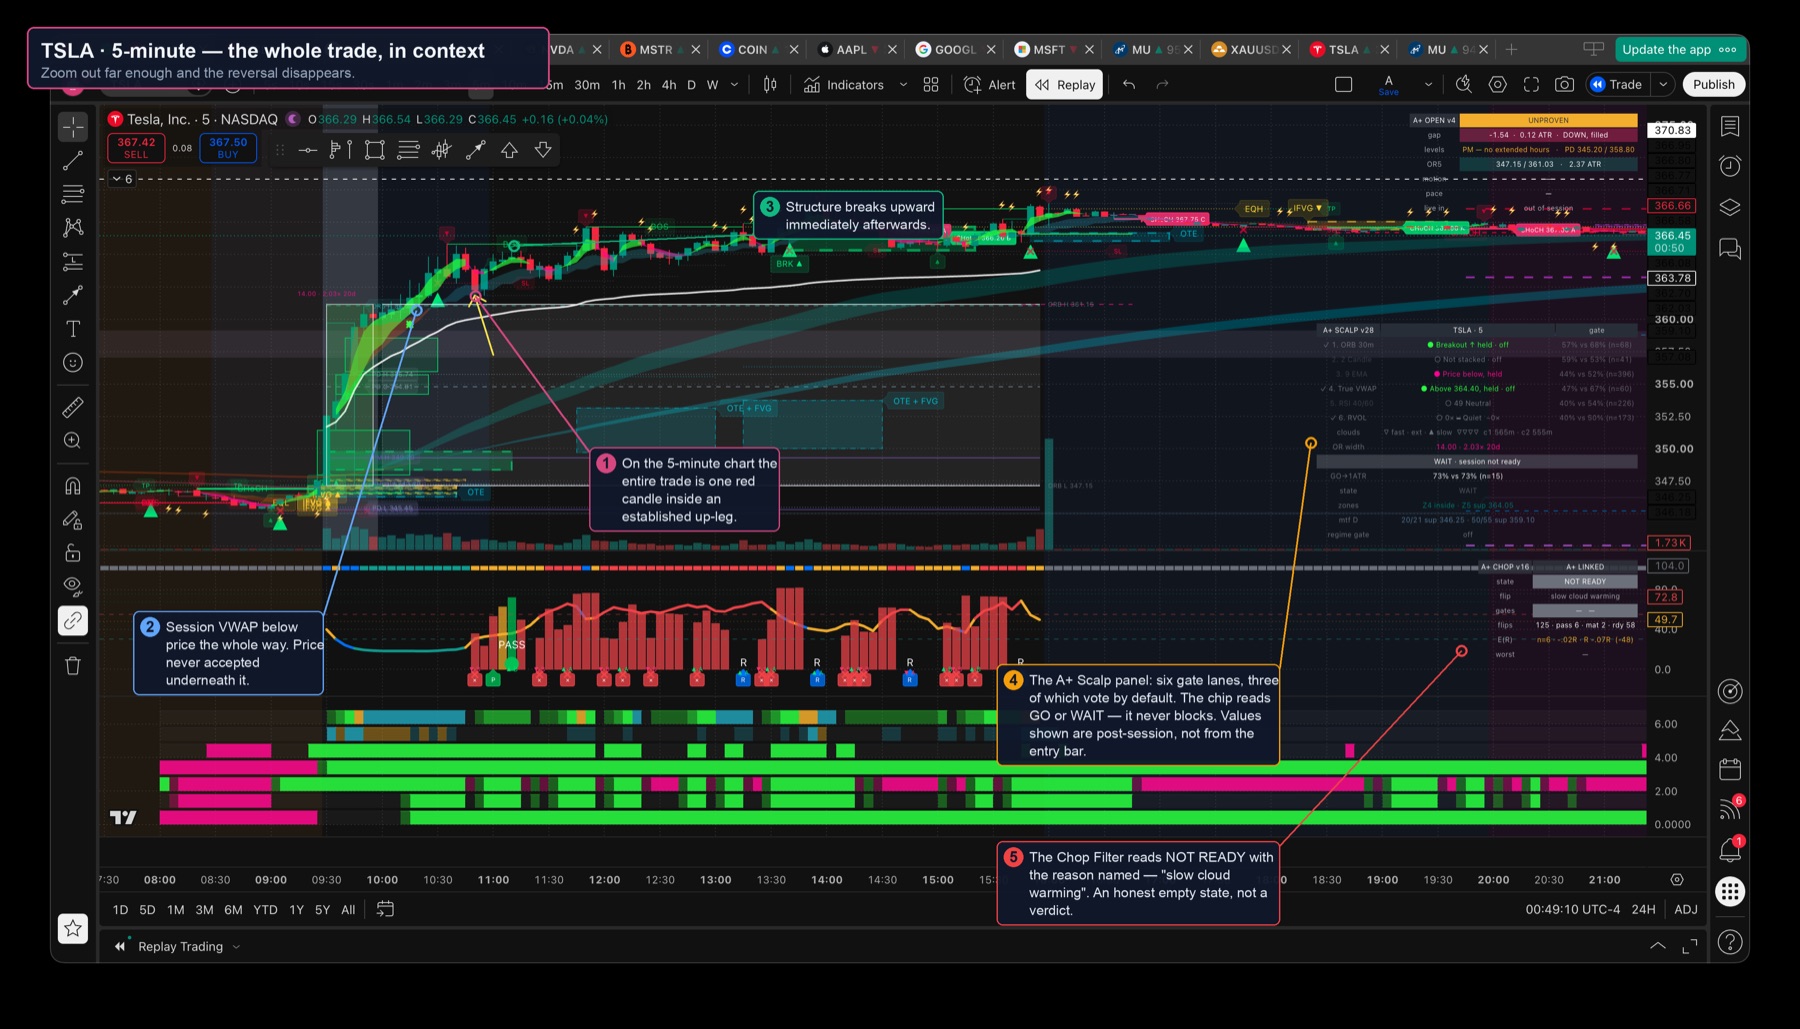
A panel like this is a discipline device, not an oracle. Six gate lanes are displayed; three of them vote by default, and the chip they produce reads GO or WAIT — it never "blocks". Three lanes display, hold and get scored without ever granting permission, which is a design choice worth copying: showing a reading and acting on one are different permissions.
Two things about the numbers on it, stated plainly because they cut against our own work:
- The fast-cloud flip — the single most actionable event on the chart — was measured on 40 sessions across five symbols using the real cloud definition: E(R) = +0.007 R ±0.061, n = 2,082, win rate 32%, stopped out 67%. That is bounded tightly at zero. It is a state descriptor, not an edge, and every modifier tested on it — waiting 3, 5 or 7 bars, requiring a prior structure warning, filtering by relative volume — lands inside the same interval.
- The structure module in these screenshots carries a permanent UNPROVEN badge: 2,886 events, E(R) −0.01, 95% CI [−0.06, +0.04]. It draws and it does not signal. The badge stays until a study produces an interval excluding zero.
- Every threshold in a system like this — the pass marks, the spacing minimum, the expansion floor — was calibrated by eye on the same history it was then measured against. A number formed and confirmed on one window is a description of that window, not a finding.
The governing principle behind all of it, and the one worth stealing whatever tools you use:
For a quick options scalp, a false pass costs more than a missed trade. The goal is not to catch every signal. The goal is that when it says yes, yes means something. It will block trades that would have worked — that is the trade you are making.
The takeaway
Four sentences carry the whole method:
- Context tells you direction. Regime — VWAP and the slow cloud — decides which side you are allowed to look for.
- Location tells you where. Never into support, never into resistance.
- Structure tells you whether. A CHoCH is a warning; the chain through failed reclaim and lower high is the reversal.
- The candle tells you when. It is the trigger, and it is the last thing to consult, not the first.
Run those in that order and the premature reversal entry — the one that is right about direction, early by three states, and aimed at a support stack — becomes very hard to take by accident.