Edges
Pressure Break: Do Multiple Tests of Support Make It Break?
Do multiple tests of support make a level more likely to break? Many scalpers believe so: price hits the same floor three or four times, each bounce gets weaker, and then the floor gives way. We call this read the A+ Pressure Break (APB). It is easy to spot on a 1-minute chart, and it feels like the market is telling you where it is going next. We wrote the pattern down as rules and tested it on 19,276 breaks across seven liquid tickers. This guide covers how to read it and what the data showed. Short version: the read is real, but we found no edge in it.
What the A+ Pressure Break is
The A+ Pressure Break is a 1-minute breakout read. It looks for a price boundary that gets attacked again and again while the side defending it shows less strength each time. For a breakdown, that means repeated tests of support, each bounce smaller than the last, retests arriving faster, and lower highs squeezing into the level. The mirror image works for a breakout through resistance: rejections get shallower and higher lows press into the ceiling.
Two rules separate it from a plain "support broke" trade:
- The tests arm the setup. They never trigger it. Four touches do not mean a level must break. The touches only tell you where to pay attention.
- Entry requires acceptance beyond the level. A candle body has to close through the zone. Then you need a stop you can point at and enough room to the next zone.
The logic behind the idea is simple. Say support sits at a hypothetical 100.00. Buyers defend it and push price to 101.00. On the next test they only reach 100.60, and on the third only 100.25. The level is still "holding", but each defence buys less distance. That fading response is what the pattern tries to measure.
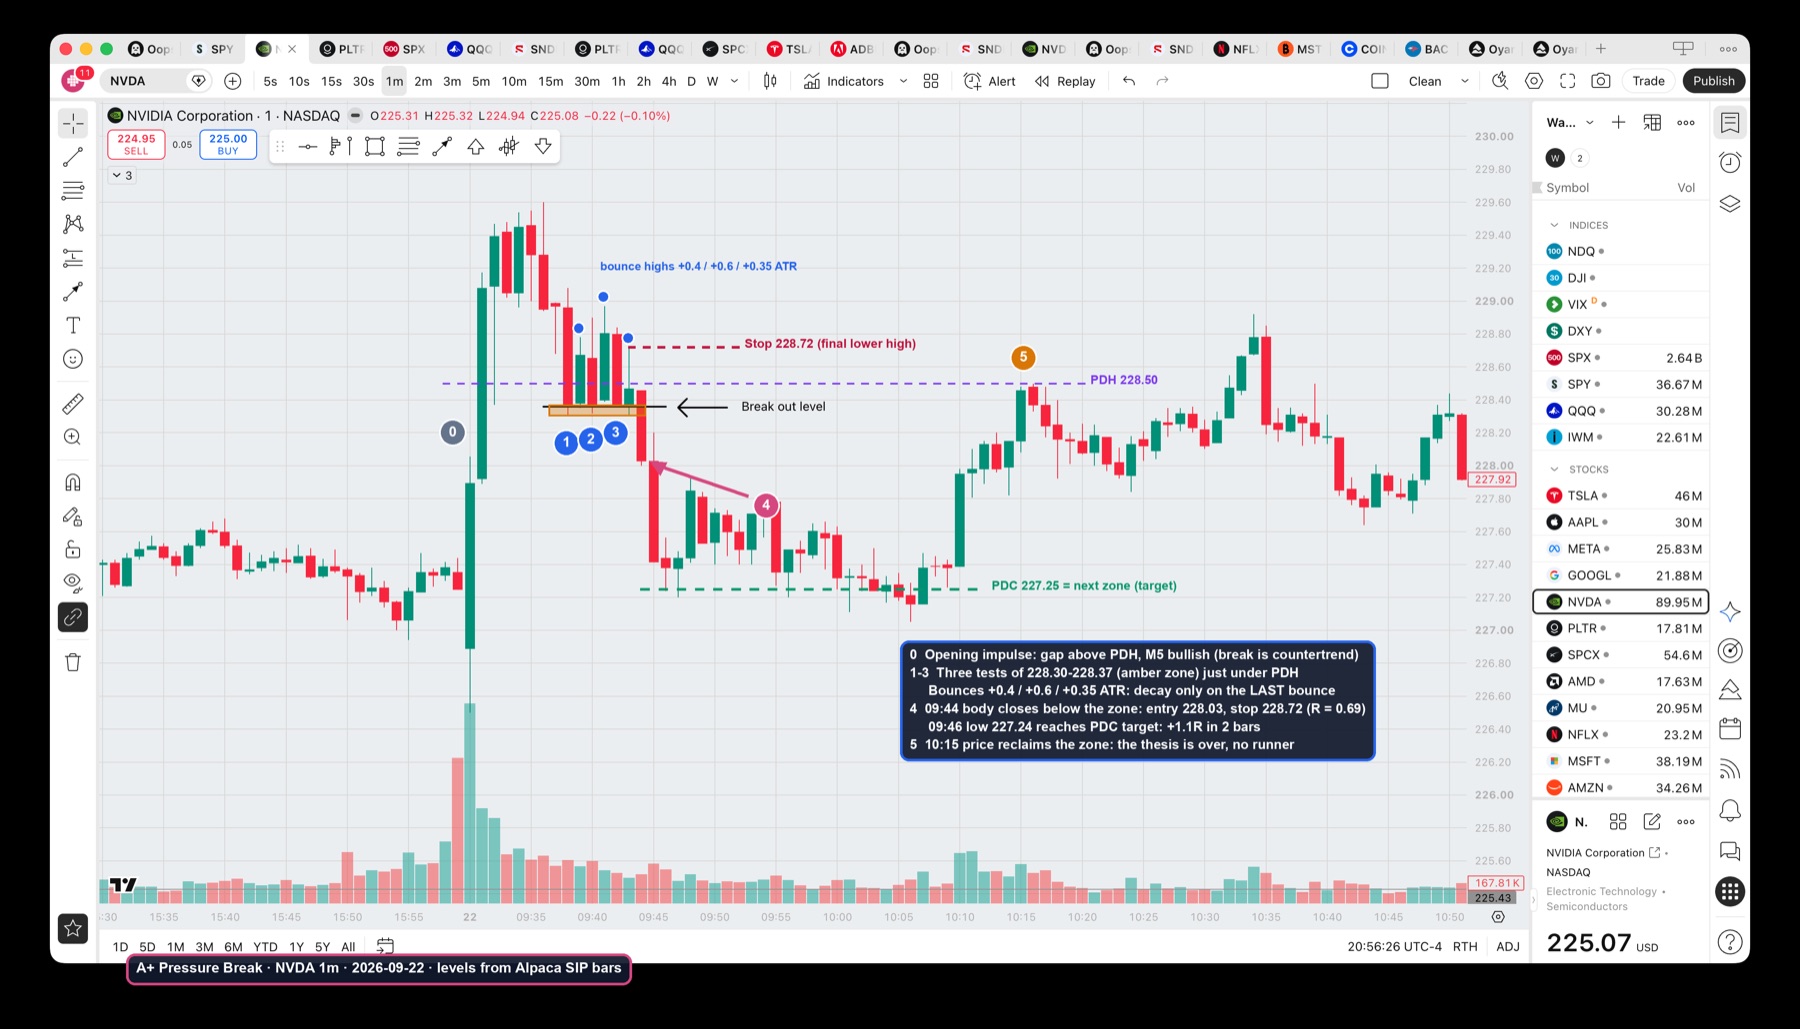
Reading the NVDA example step by step
The screenshot above started this study. It is a good example, but it breaks one of the pattern's own rules, so it teaches more than a perfect one would.
- Context (0): NVDA gapped and ran more than 2.5 points in the first five minutes, clearing the prior-day high at 228.50. The 5-minute structure was strongly bullish, so a breakdown here goes against the dominant move.
- Pressure (1–3): Price pulled back into 228.30–228.37 and tested it at 09:38, 09:40 and 09:42. The bounces reached 0.41, 0.60 and 0.35 ATR. That is decay on the final bounce only, not a clean staircase.
- Break (4): The 09:44 candle closed its body at 228.03, below the zone. The final lower high at 228.72 set the stop, so the risk was 0.69 points.
- Room: The next zone below was the prior-day close at 227.25, 1.1R away. The 09:46 low of 227.24 reached it two bars later.
- Reclaim (5): By 10:15 price was back above the zone at the prior-day high. Anyone holding a runner gave the gain back.
What to take from it: the trade worked because the room to the prior-day close was there and the target was taken immediately. It did not work because the level was tested three times.
Why multiple tests of support can weaken a level
A pressure read comes from six measurements. They are listed here for a breakdown; reverse every one for a breakout.
| Measurement | What you look for | How to measure it on M1 |
|---|---|---|
| Test count | 3 to 5 separate touches of one zone | A test only counts if price moved at least ~0.35 ATR away since the last one |
| Zone, not price | Touches land inside one band | Band width within about 0.3 ATR, never an exact tick |
| Bounce decay | Each defence buys less distance | Last bounce ≤ 70% of the strongest earlier bounce, measured in ATR |
| Return speed | Retests arrive faster | Minutes between tests shrink, e.g. 8 → 5 → 2 |
| Compression | Lower highs into support | The final lower high sits below the first bounce high |
| Break quality | A body closes through with force | Close beyond the zone, body ≥ 1 ATR, first close outside |
Test count needs a warning. More touches do not keep making the level weaker. At six or more touches, price is usually balancing around the level rather than pressing it, and the level stops working as a boundary. Our data shows no gradient either. Breaks after three, four and five tests averaged −0.015R, −0.021R and −0.053R. The six-plus bucket read +0.12R, but on only 212 trades with a ±0.15R range, which is too few to separate from zero.
Try it on your own chart. The calculator below scores a sequence of tests. It includes the NVDA and TSLA sequences from this article and one healthy-defence case for comparison.
From armed to confirmed: the pressure break state machine
A written state machine keeps you from entering early. The pressure part arms the setup, and only the break can confirm it.
The playbook has three entry models:
- Break close (default). Enter after the 1-minute candle closes its body beyond the zone. It is objective and filters out wick fakeouts, but the entry is later.
- Momentum break. Enter while price trades through the level, before the candle closes. The entry is better, and so is the fakeout risk.
- Break and retest. Wait for price to come back to the broken zone and reject it. The stop is tighter, but fast breaks often never retest.
In every model, the stop sits where the thesis is wrong: above the final lower high for a breakdown, below the final higher low for a breakout. Position size comes from that distance, not the other way round. If price closes back inside the zone within a few bars, acceptance has failed and the thesis is over.
A wick through the level that closes back inside is not a pressure break. It is a sweep, and it can reverse hard. Our guide to liquidity sweep trading covers that case. The fake breakout impulse article explains why fast breaks so often fail.
Adding zones: PDH, PDL, premarket levels and supply/demand
The natural upgrade is to trade pressure only at levels that matter. The playbook version uses:
- Session levels: prior-day high, low and close (PDH, PDL, PDC), and premarket high and low (PMH, PML).
- Opening range: the high and low of the first 15 minutes.
- Day extremes: a base forming at the current high or low of day.
- Supply and demand zones: the base candle before an intraday move of at least 2 ATR within three bars.
- Target zones: the same levels plus VWAP act as targets. The distance from entry to the next zone, divided by the stop distance, is the "room" in R.
The theory predicts two gains. Breaks at real levels should follow through more often, and targeting the next zone should improve reward-to-risk. The checklist below encodes this full version with gates. The panel also states what the data says about it.
We tested the pressure break on 19,276 breaks
A chart-by-chart review cannot settle this. Everyone remembers the breaks that ran. So we wrote the rules as code and ran them over every 1-minute session from March 2 to September 24, 2026. Tickers: SPY, QQQ, IWM, TSLA, AAPL, META and NVDA, all on consolidated (SIP) bars.
The mechanics:
- Candidate: any first body close beyond a zone that price had tested at least twice.
- Entry: the break candle's close. Stop: the final lower high (or higher low) before the break.
- Target: the next zone in the break direction (a PD, premarket or opening-range level, VWAP, or a supply/demand base), capped at 3R.
- Exit: target, stop, or a 60-minute timeout at market.
- Holdout: every rule was set before looking at August and September. Those two months are reported separately.
- Costs: not included. Any commission or slippage lowers every number below.
Why test it as code instead of by eye?
Reading charts by eye has two biases. You remember the textbook breaks that ran and forget the ones that snapped back. And you can only judge a pattern as clean after seeing how it resolved. Code applies one definition to every session, winners and losers alike. The cost is that code is a proxy for a trader's discretion. That is why we also ran a strict tier with every gate from the checklist turned on.
Results: the pressure read adds no edge
Expectancy is the average result per trade in R, with the 95% range in brackets.
| Group | Trades | Win rate | Mar–Jul | Aug–Sep holdout |
|---|---|---|---|---|
| All breaks of a tested zone | 19,276 | 57.9% | −0.019 (±0.016) | −0.016 (±0.028) |
| Two touches only (control) | 7,517 | 56.9% | −0.031 (±0.026) | −0.020 (±0.046) |
| Pressure read: 3+ tests, decay, compression | 8,475 | 56.2% | −0.019 (±0.026) | −0.006 (±0.044) |
| Pressure at PDH/PDL/PDC/PMH/PML/OR | 1,430 | 57.8% | −0.031 (±0.059) | −0.029 (±0.101) |
| Pressure at a supply/demand zone | 2,265 | 61.1% | −0.038 (±0.044) | −0.019 (±0.077) |
| Pressure at no zone at all | 4,864 | 54.5% | −0.016 (±0.035) | +0.005 (±0.059) |
| Strict A+ tier (every gate on) | 191 | 36.1% | +0.084 (±0.267) | +0.029 (±0.355) |
Three findings stand out:
- Pressure adds nothing to a plain break. The full pressure read (three or more tests, fading bounces, compression) scored the same as breaks after two touches.
- Levels add nothing to pressure. Pressure at a prior-day or premarket level did no better than pressure at no level at all. Supply/demand zones had the highest win rate and one of the lowest expectancies.
- The strict tier is noise. It looked slightly positive in-sample and stayed inside a ±0.36R noise band on holdout. Its break-and-retest version flipped from +0.38R in-sample to −0.37R on holdout, which is what an overfit rule looks like.
Some individual features did not help either. A break body of at least 1 ATR averaged −0.008R. Strong decay (last bounce ≤ 50% of the strongest) averaged −0.023R. An exit at the first close back inside the zone averaged −0.009R in-sample and −0.011R on holdout, no better than holding to the stop.
Zoning does not boost R:R: it moves you along the breakeven curve
The zoning idea's main promise was better reward-to-risk. It does deliver a bigger average winner. But requiring at least 1.5R of room raised the average winner from +0.47R to +2.14R and cut the win rate from 66% to 32%. Expectancy stayed where it was.
That is not a flaw in this study. It follows from the arithmetic. With a fixed 1R loss and average winner , the win rate you need to break even is:
A 0.5R winner needs a 67% win rate. A 2R winner needs 33%. Our groups landed almost exactly on that curve. A bigger target moves a setup along the breakeven line. Only real information about direction moves it above the line, and in this test neither the pressure read nor the zones provided it. The explorer plots every tested group against the breakeven curve. Add your own costs and watch the curve rise.
Six real examples, picked by a rule
To avoid showing only the charts that worked, we picked examples mechanically: the most recent strict-tier signal for each of six tickers, whatever the outcome. One of the six won. That is close to the tier's 36% win rate.
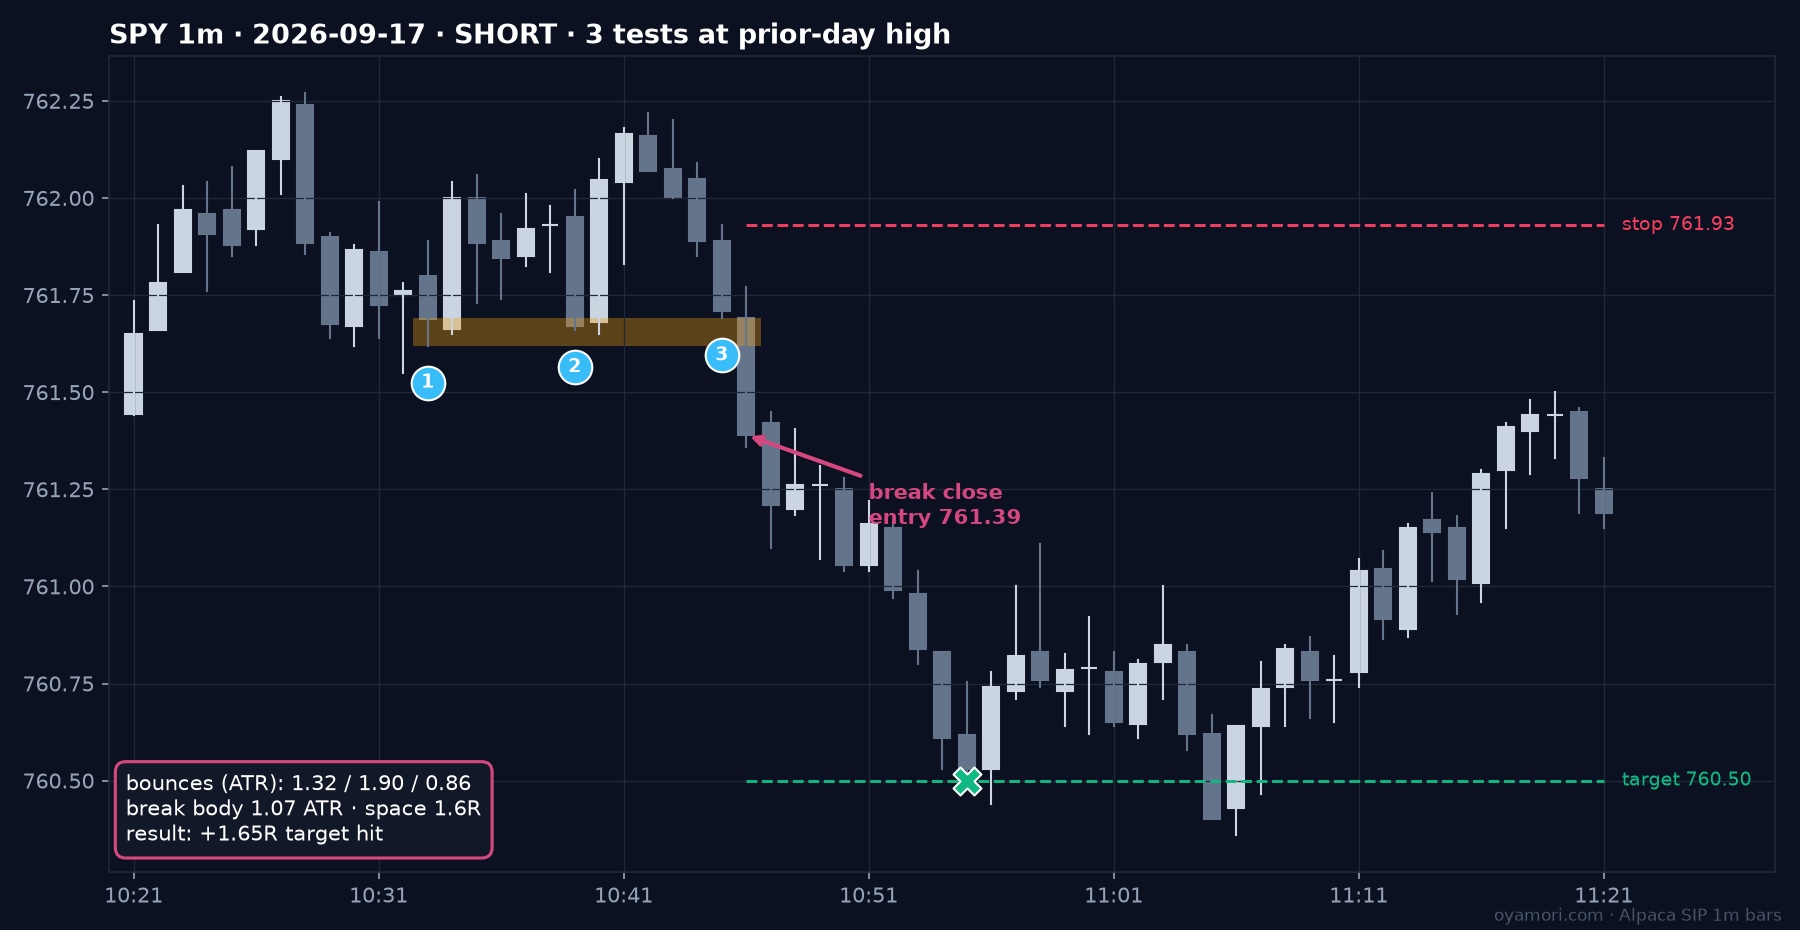
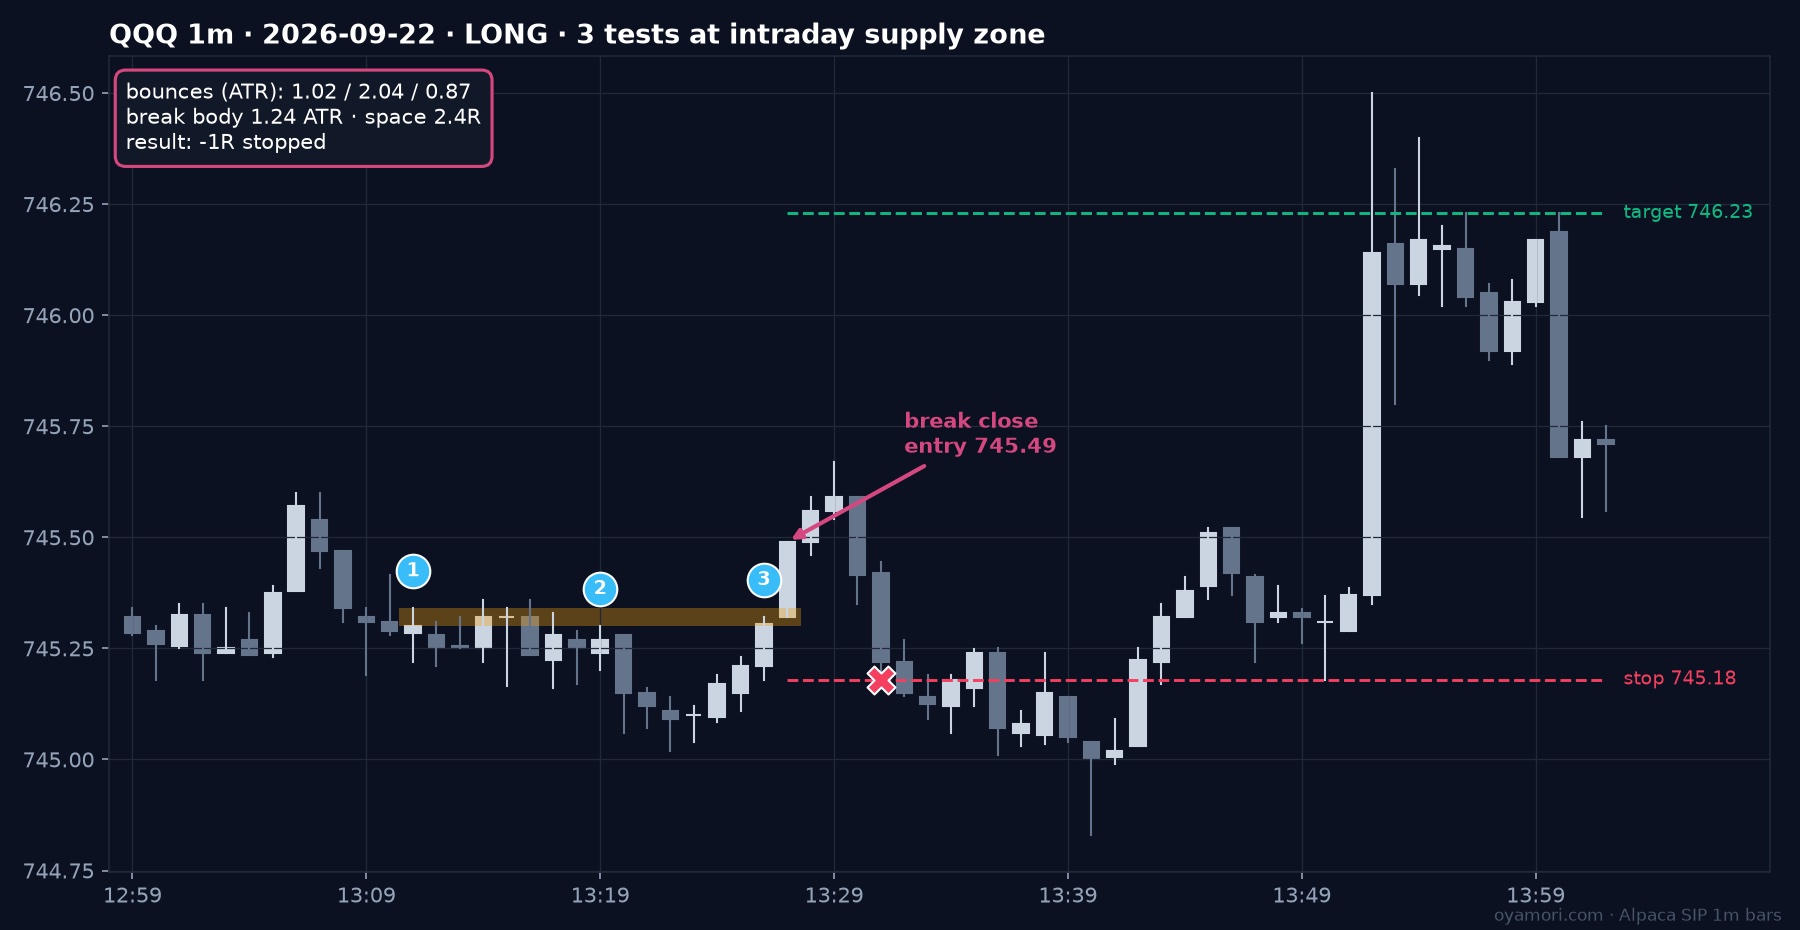
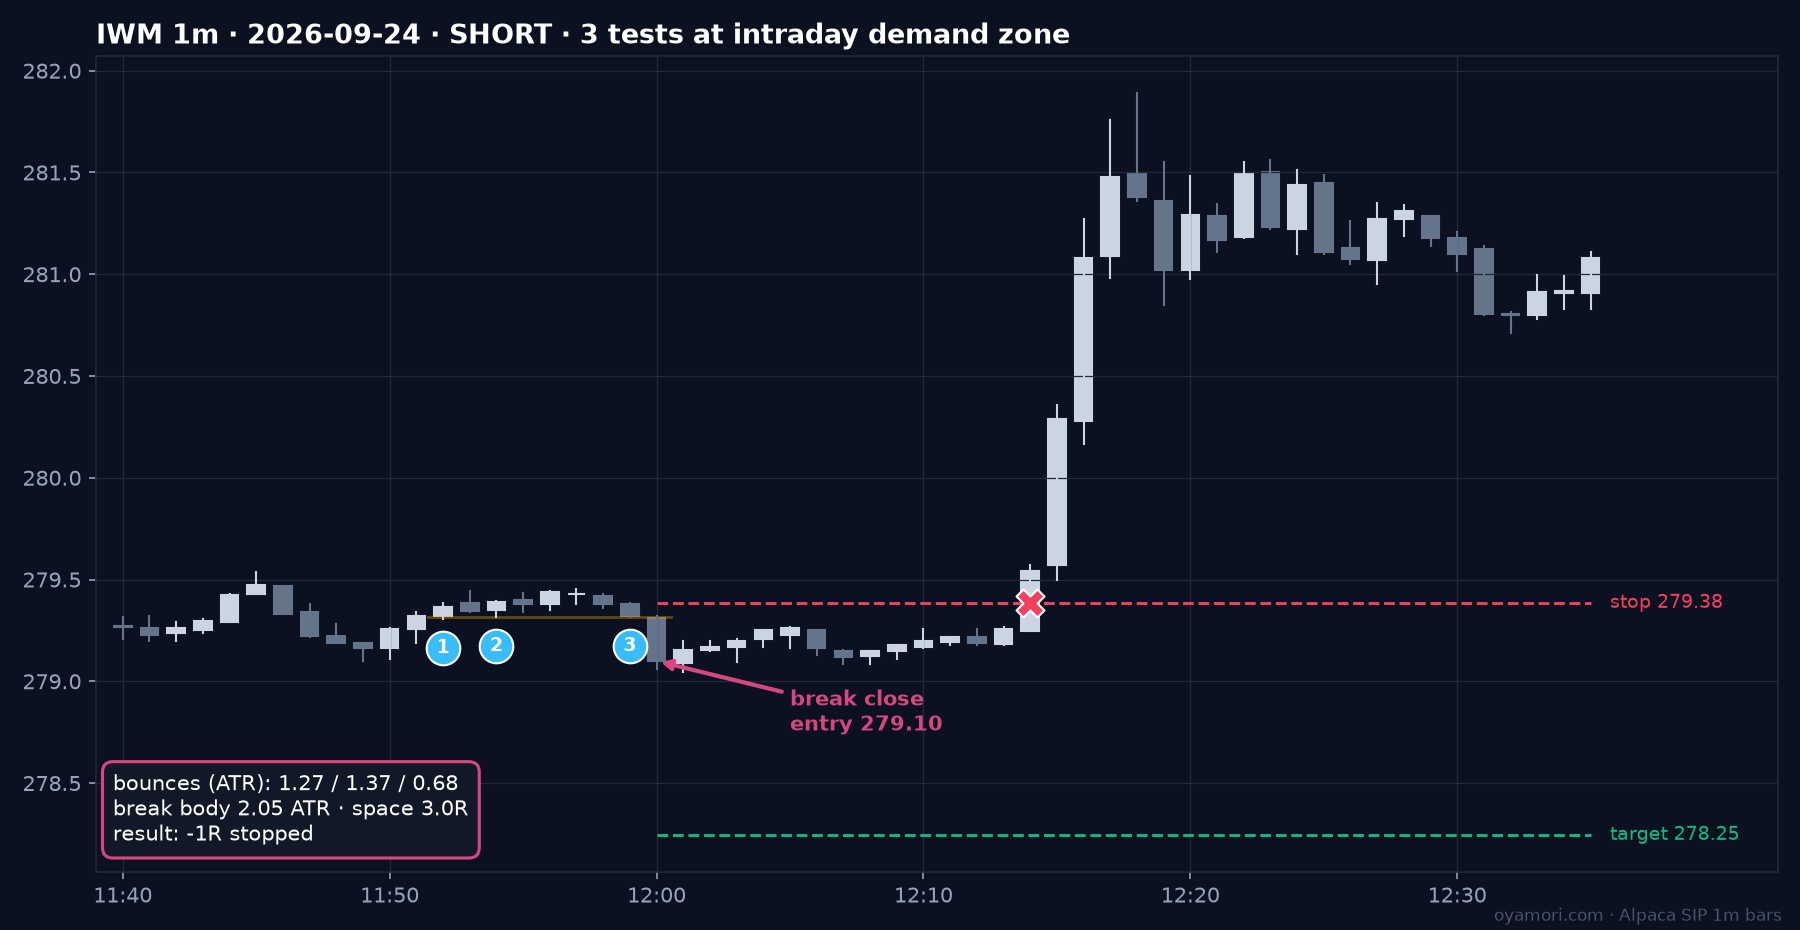
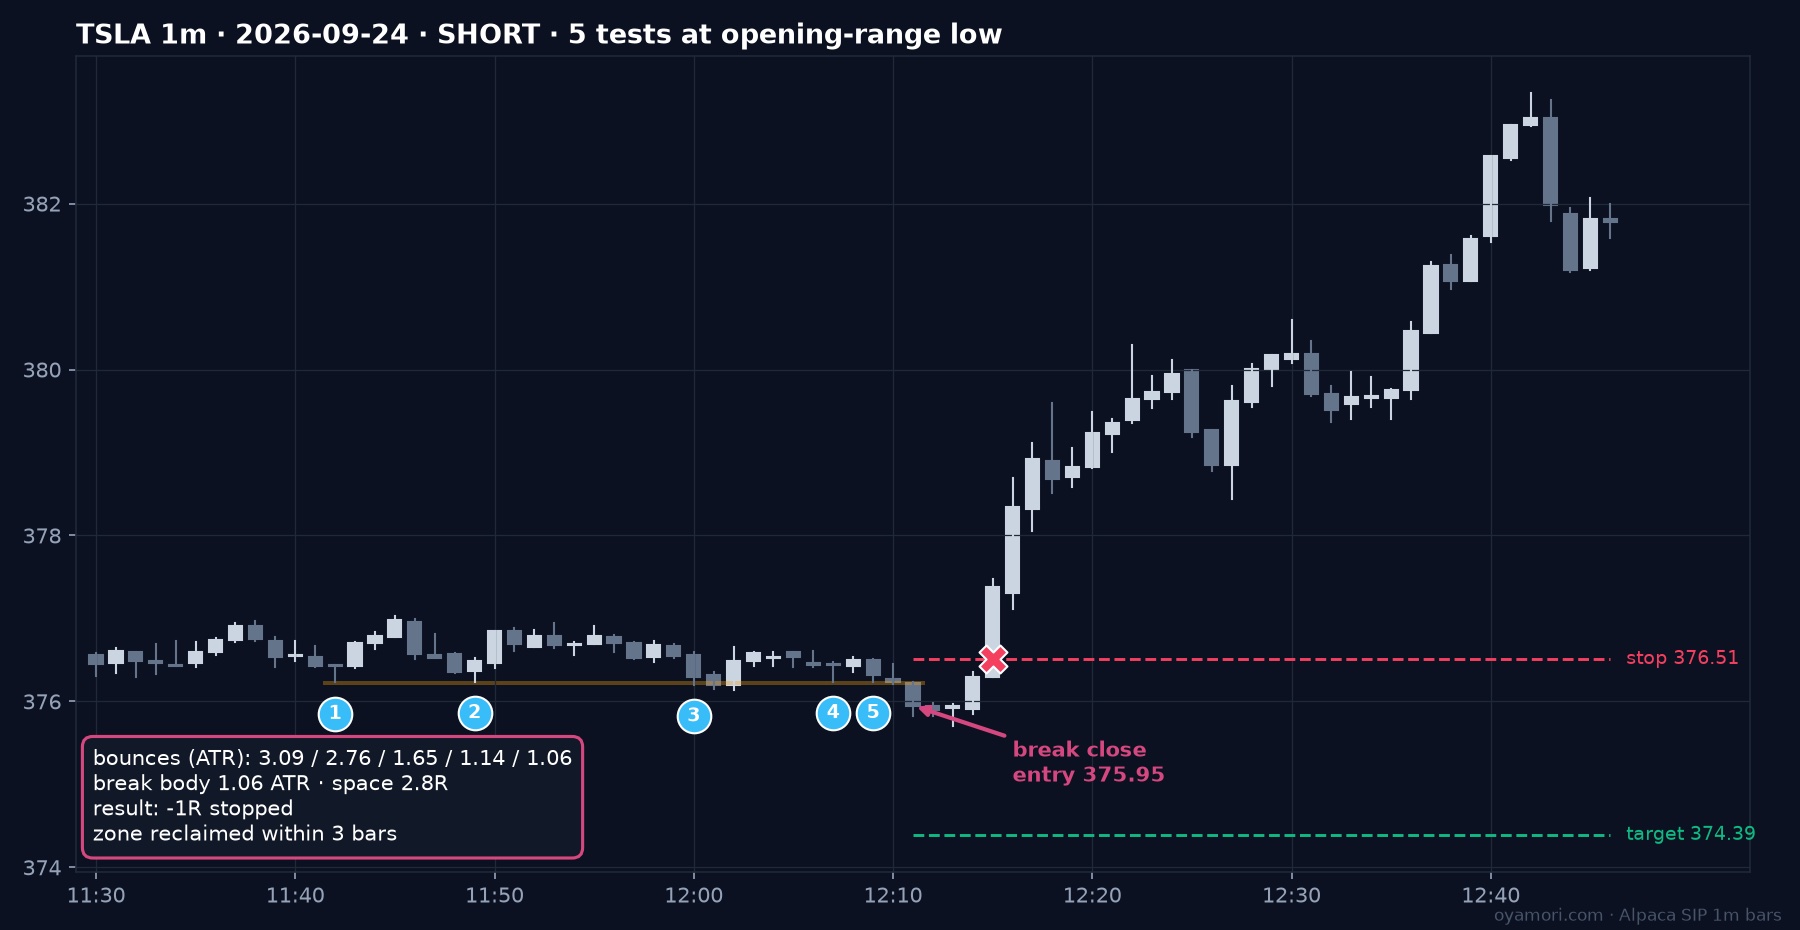
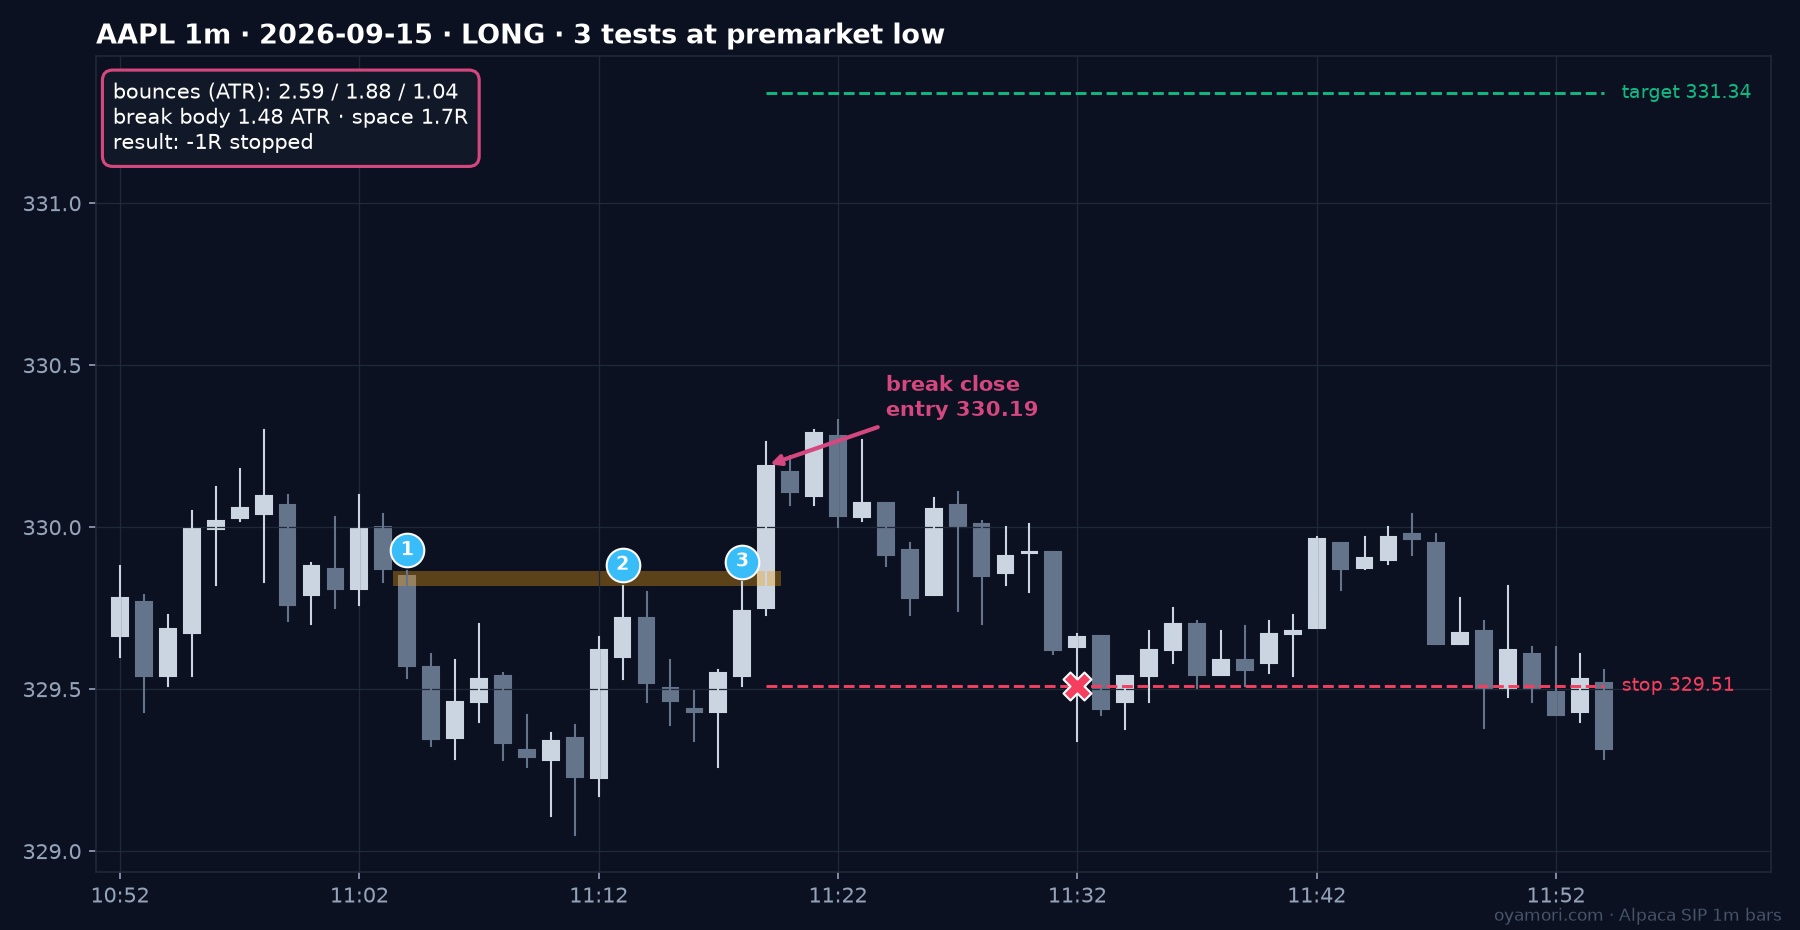
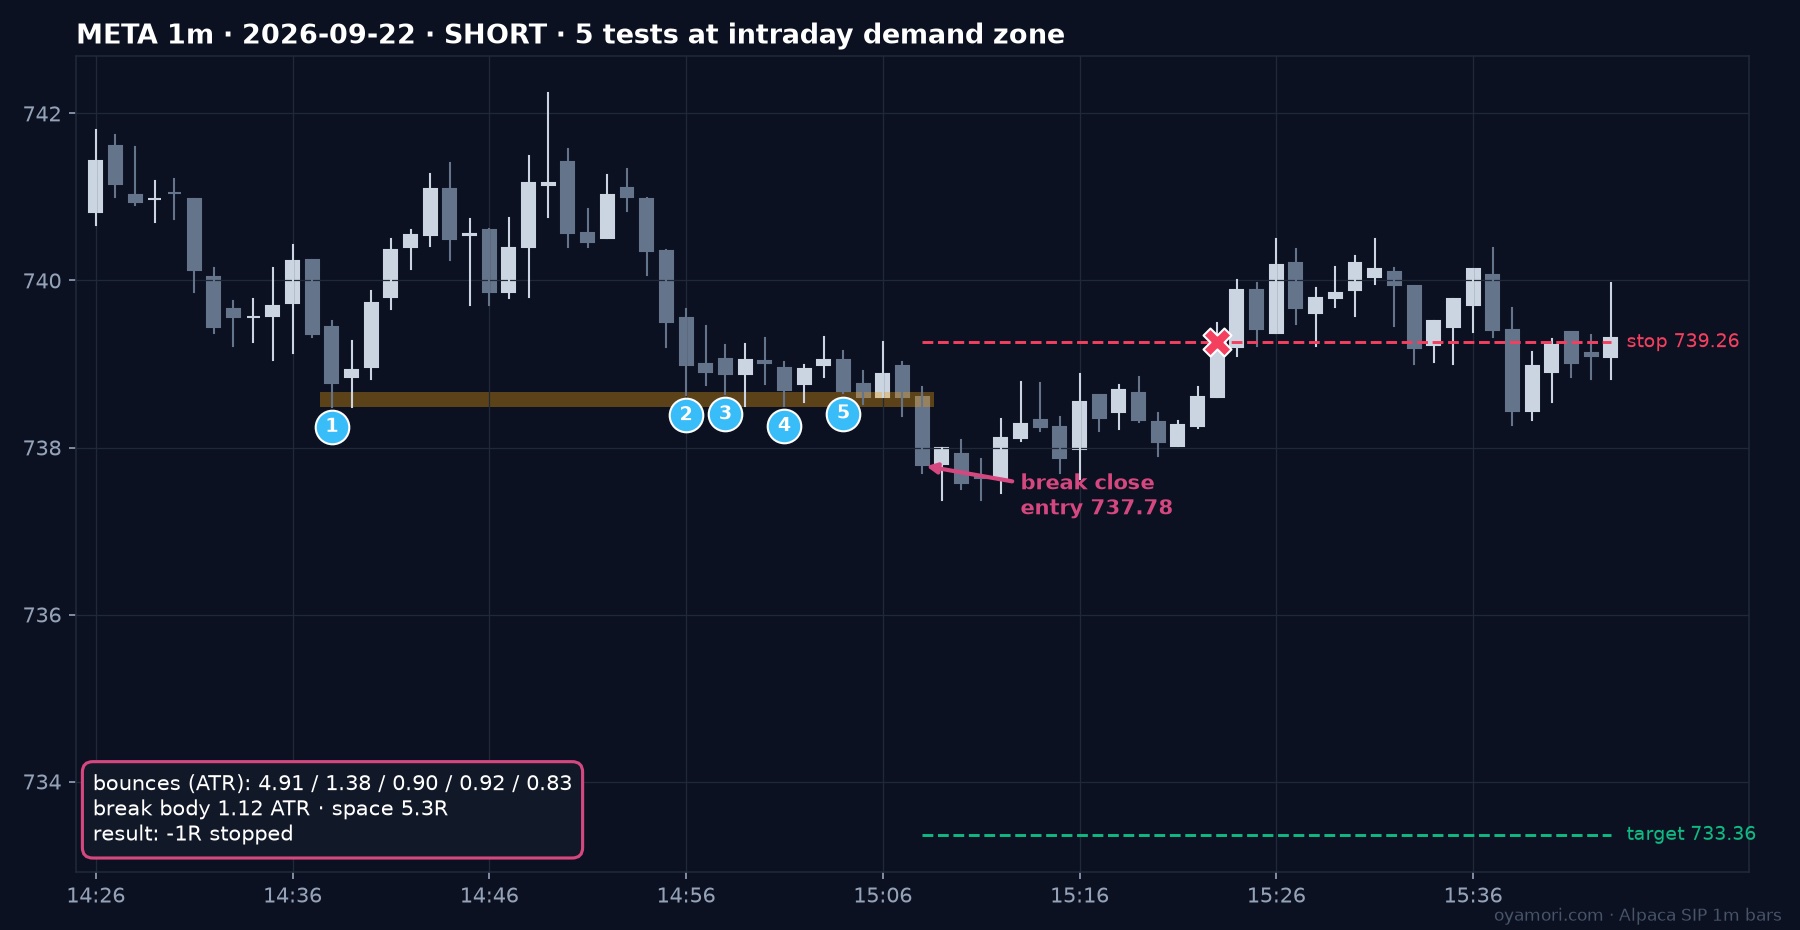
The TSLA chart makes the point best. By every visual standard in the checklist, it was the best-looking setup of the six, and it became the most violent loss.
How to use a pressure read without treating it as an edge
A read with no statistical edge can still be useful, as long as you know what it does and does not tell you:
- Use it to decide where to look. Repeated pressure at a named level marks where the next decisive move is likely to start. It does not tell you which way that move will go.
- Size by structure, never by touch count. Take the stop from the final lower high or higher low, then set position size from that distance. A fifth touch does not justify a bigger size.
- Measure room before you enter. If the next zone is under 1.5R away, pass. But don't expect more room to raise expectancy: it only reshapes how the losses and wins arrive.
- Log your own read. Your discretionary read may filter better than our code did. The only way to know is 50–100 logged trades with entry, stop, room and result in R. Compare them against the curve in the explorer above.
- Respect the base rate. In this sample, a 1-minute break of a tested zone, with a structural stop and a zone-based target, was a coin flip before costs. Any setup you build on it has to show that it beats that coin flip.
For how to draw the levels themselves, see our guide to trading support and resistance. For the execution side of 1-minute breaks, see price-action-first breakout scalp entries.
Does this prove multiple tests of support never matter?
No. It shows that one clear, reasonable coding of the idea, run on seven liquid tickers over seven months of 1-minute bars, found no measurable edge. It says nothing about other timeframes, illiquid names, or information the candles cannot see, such as order-book depth. It does say that the visual version of this pattern is not enough on its own.
Why do the win rates look good if the edge is zero?
Win rate depends mostly on how far the target is. Close targets win often and pay little; far targets win rarely and pay a lot. A 66% win rate with a 0.47R average winner and a 32% win rate with a 2.14R average winner are the same trade. Judge a setup by expectancy per trade, never by win rate alone.
Why does the strict A+ tier look positive in-sample?
With 130 trades and a spread of results near ±1.5R, an average of +0.08R is well inside what chance produces. The holdout confirms it. The break-and-retest version of the same tier swung from +0.38R to −0.37R between periods, which is what a filter that fits noise looks like.