Edges
Fake Breakouts: Why You Don't Need to Tell Them Apart
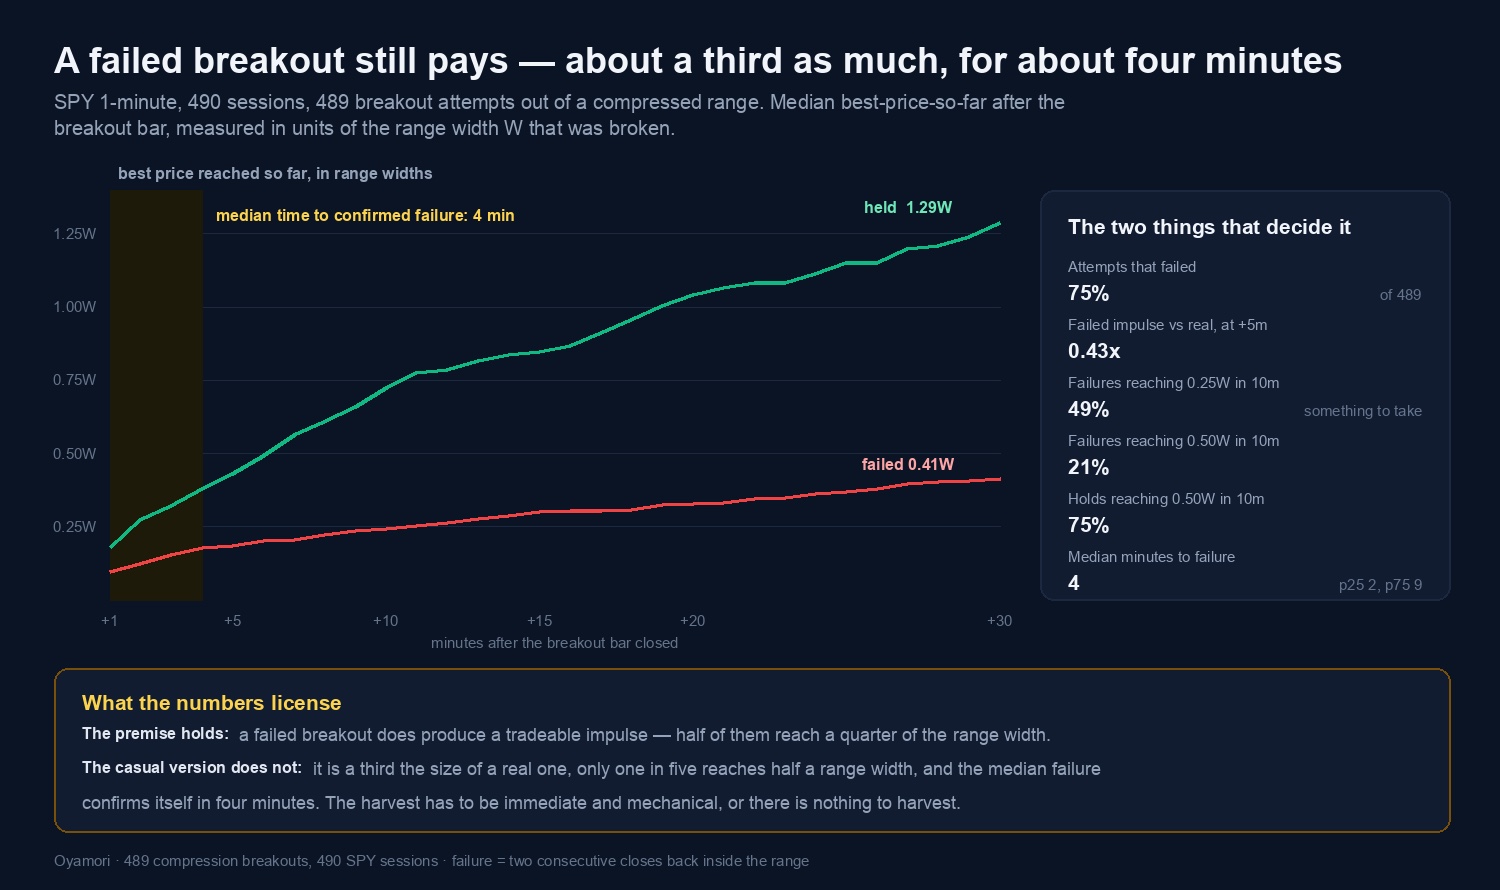
Almost every lesson on fake breakouts is a lesson in prediction: here are the tells, here is how to know in advance whether this one is real. That framing is the problem. A breakout and a fake breakout begin identically, by construction — and the traders who do well on them are not the ones who guessed right, they are the ones whose plan did not require guessing.
We tested the premise underneath that claim on 489 real breakouts and it came back split: the idea holds, and the casual version of it does not survive contact with the numbers.
Both outcomes start with the same event
When price closes beyond the edge of a range, the same sequence fires regardless of what happens next:
Nothing in that chain knows whether the move will be accepted. Stops trigger because they were resting there, not because the breakout was correct. That is precisely why the impulse is common ground — and why it is the part of the move that can be monetised without a forecast.
The question is whether the impulse on a failed breakout is big enough to be worth anything. That is measurable, so we measured it.
The test: does a failed breakout still pay?
489 breakout attempts on SPY 1-minute bars across 490 sessions, taken only where a range had genuinely compressed first, between 09:45 and 14:30 ET. Every result is scaled by W — the width of the range that broke — so it compares across days.
| Median best price reached | +3 min | +5 min | +10 min | +30 min |
|---|---|---|---|---|
| Breakouts that held (n=124) | 0.32W | 0.43W | 0.72W | 1.29W |
| Breakouts that failed (n=365) | 0.16W | 0.19W | 0.24W | 0.41W |
The premise holds. A failed breakout is not an instant reversal — it moves in your favour first. Half of them (49%) reach a quarter of the range width within ten minutes.
And the casual version dies. The failed impulse is roughly a third the size of a real one. Only 21% of failures reach half a range width, against 75% of the ones that held. And the median failure confirms itself in four minutes (p25 2, p75 9).
How was "failed" defined, and does the definition change the answer?
Three ways, and the article reports the range rather than picking the flattering one. Any close back inside the range within 30 minutes: 83% of attempts. Two consecutive closes back inside — the one used above, because a single poke back inside is often a normal retest rather than a failure: 75%. Still inside the range at the 30-minute mark: 47%. The middle definition is the honest one for a scalper, and it is the strictest of the three that does not punish a healthy retest. The MFE gap between the groups is similar under all three.
What the numbers license: harvest, protect, participate
If the impulse is real but small and brief, and the outcome is unknowable at entry, then the correct response is not a better filter. It is a position structure that gets paid by the part you know exists.
The logic is uncomfortable for anyone trained to let winners run: you are selling into strength before you know whether the strength meant anything. That is the point. With a 75% failure rate, the impulse is the only part of the distribution that shows up reliably — so it is the part you convert into money, and the remainder becomes a free option on the 25% case.
Set the campaign and compare it against holding everything:
Two confusions that cause most fake-breakout losses
The draft this article came from ends up at a state machine, and the reason is that most losses are not bad analysis — they are actions taken at a state that did not permit them.
Armed is not entry. A compressed range with a defined boundary and clean room above it is a reason to have an order ready. Traders routinely convert it into a position before anything breaks, then defend a thesis the market never confirmed.
Impulse is not validity. The burst after the break feels like proof. It is not — it is the mechanical consequence of resting orders being triggered, and the data above shows it happens in both outcomes. Reading it as confirmation is what turns a harvest into a hold.
Build the boundary as a zone, from the wicks
A breakout can only be defined against a level, and the level is usually drawn wrong.
- Do not drop the wicks. The wick extremes are where the resting orders actually sat. That is the price a breakout has to genuinely overcome, and ignoring it produces "breakouts" that never cleared anything.
- Do not use one line either. Cluster the highs and the lows into a zone. Price interacts with an area of interest, not a pixel — the same conclusion we reached in why price reverses at key levels.
- Then use the close to classify. A wick through the zone that closes back inside is a liquidity sweep. A close outside is an attempt. The wick defines the level; the body decides what just happened.
| What you see | What it is | What it licenses |
|---|---|---|
| Wick pierces the zone, closes back inside | Liquidity sweep | Watch. The level held and someone's stops just paid for it |
| Close outside the zone | Breakout attempt | Execute the plan you already wrote |
| Two consecutive closes back inside | Failure | Exit the remainder; optionally arm the reverse |
| Retest holds the zone from the other side | Acceptance | The runner earns the right to stay on |
A breakout in the right direction can still be a bad trade
The last filter has nothing to do with whether the break is real. It is whether there is anywhere to go.
If the nearest opposing level — a prior high, an unfilled gap, a supply zone, session VWAP — sits half a range width above your entry, then a correct breakout still cannot pay you, because the move ends before your first target. The runway has to be measured before the trade, not admired after it.
That check, plus the entry sequencing in our scalp entry checklist, removes more losing breakouts than any pattern-recognition improvement will.
The mistakes this framework is designed to prevent
| What most traders do | What the numbers support | |
|---|---|---|
| On the break | enter and wait to see if it is real | execute a plan written before the break |
| On the impulse | read it as confirmation, hold everything | harvest — it is the part both outcomes share |
| On the first pullback | move the stop to breakeven, get tapped out | let structure, not a round number, decide |
| On failure | give it room, hope for a second attempt | exit the remainder inside about four minutes |
| Sizing | from confidence in the setup | from risk, since 75% of attempts fail |
The takeaway
- Stop trying to classify the breakout at entry. It is not knowable then, and the plan should not require it.
- Harvest the impulse. Both outcomes produce one; failures reach a quarter of the range width about half the time.
- Do it fast. The median failure confirms in four minutes, and the failed impulse is a third the size of a real one.
- Let the remainder answer the question. Acceptance outside the range is what earns a runner — not the impulse, and not your conviction.
- Size from the 75%. Three attempts in four close back inside. A plan that only works on the fourth is not a plan.
The uncomfortable truth in the data is that you were never going to tell them apart in advance. The good news is that you do not have to, provided you take something while the market is still deciding.