Edges
Intraday Relative Volume: The Baseline Almost Everyone Gets Wrong
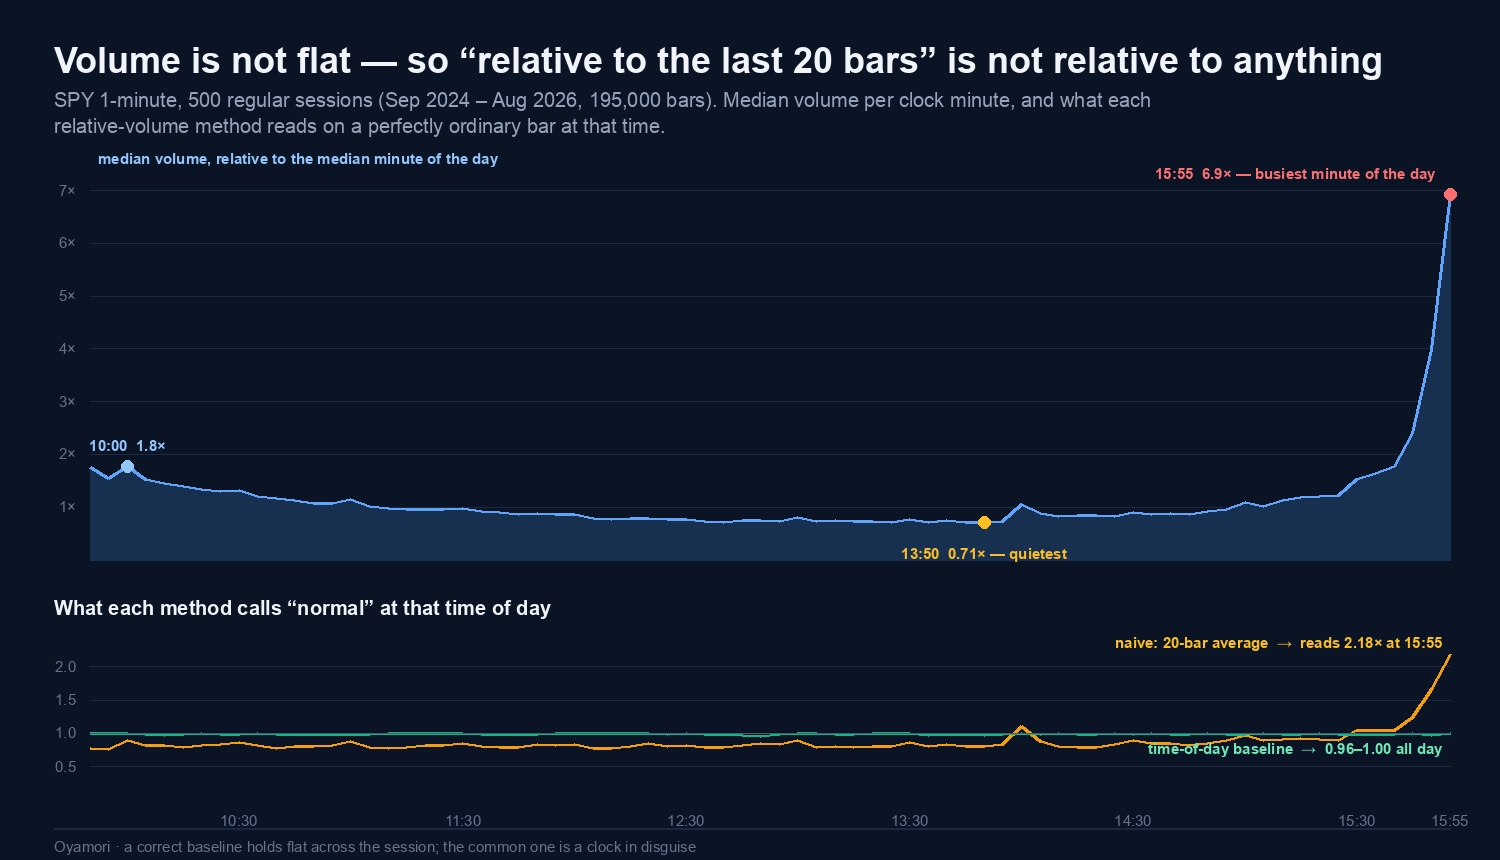
Intraday relative volume is nearly always computed the same way — this bar's volume against the average of the last twenty bars — and that method is wrong for a reason that has nothing to do with markets. Volume follows a fixed daily shape. Measuring a bar against its immediate neighbours mostly measures what time it is, not whether anything happened.
Here is the same candle, on the same chart, being read two ways at once:
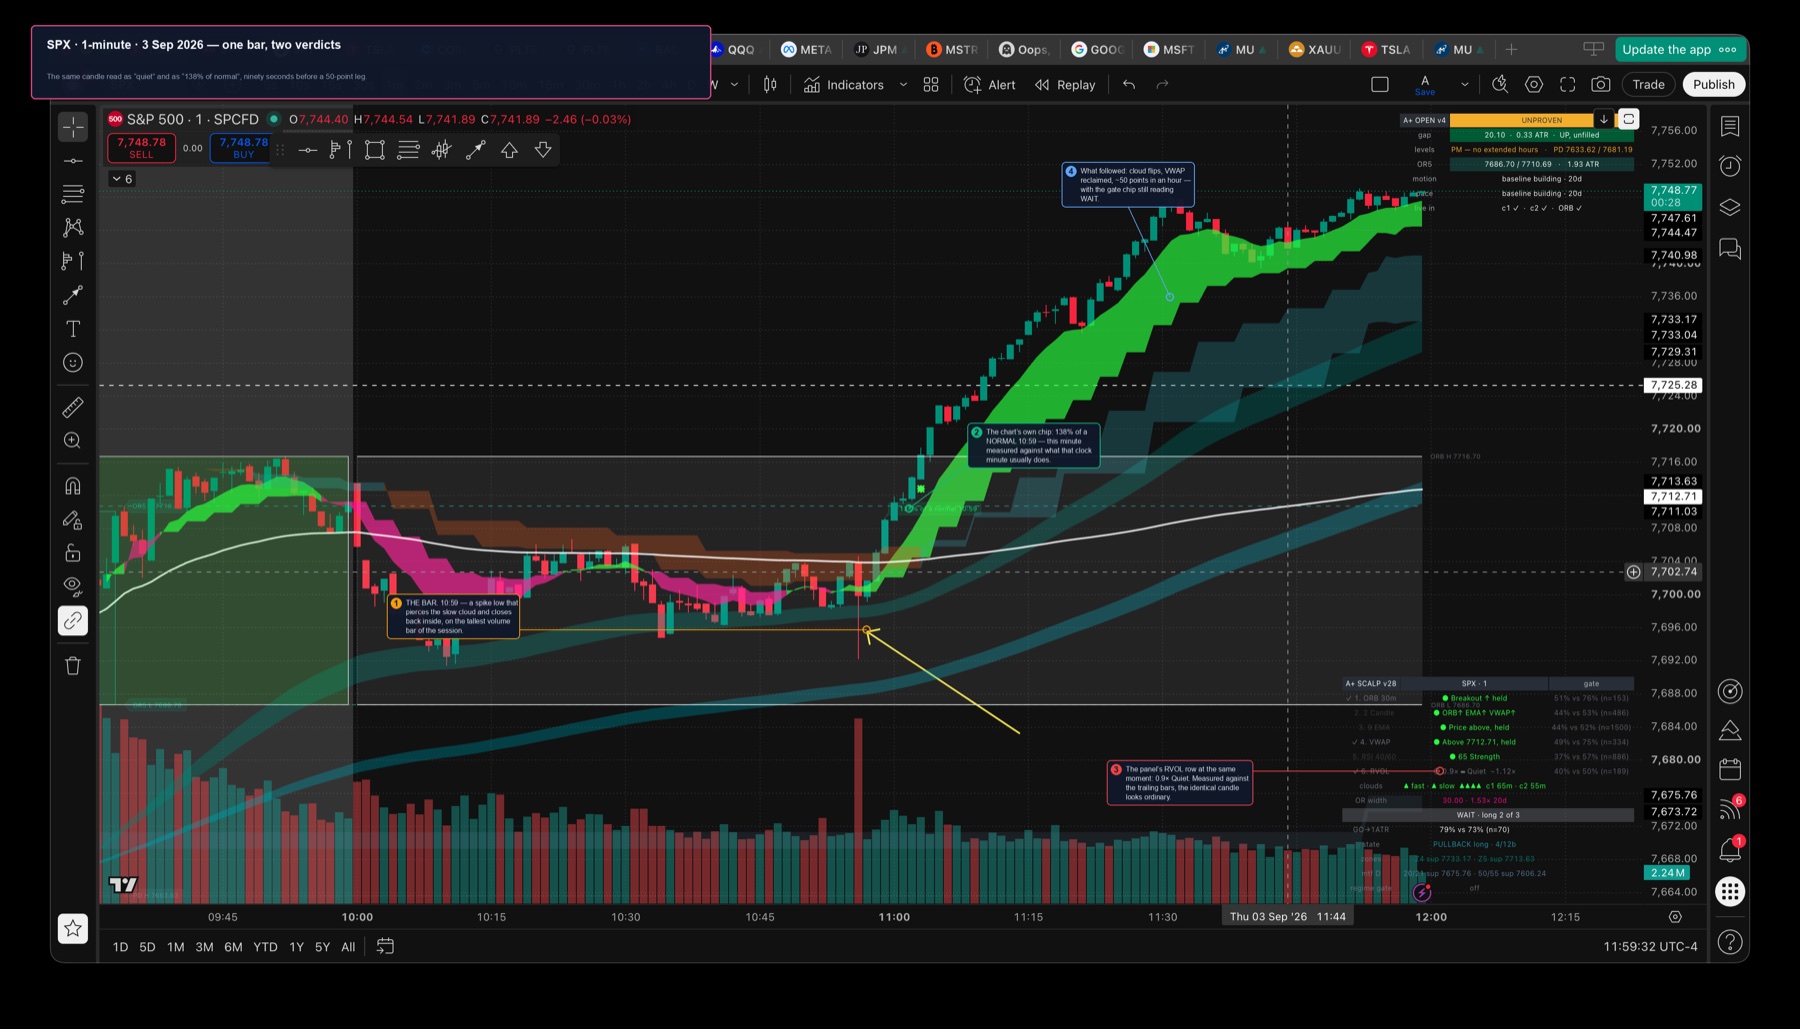
Both numbers are arithmetically correct. They disagree because they answer different questions — and only one of them is the question you meant to ask.
Volume has a shape, and the trailing average is standing inside it
We pulled SPY 1-minute regular-session bars for 500 sessions — 3 September 2024 to 31 August 2026, 195,000 bars — and took the median volume of every clock minute.
The consequence is the lower panel. On an ordinary bar — nothing happening, a median-volume minute for that time of day — the trailing-20 method reads:
| Time of day | Naive reading on a normal bar | Time-of-day reading |
|---|---|---|
| Mid-session (12:00–14:00) | 0.76 – 0.82× | 0.98 – 1.00× |
| Into the close (15:55) | 2.18× | 0.99× |
| Across the whole session | swings 0.76 → 2.18 | holds 0.96 – 1.00 |
A correct baseline has to read about 1.0 on a typical bar at every time of day. The time-of-day version does. The trailing-average version calls a completely unremarkable 15:55 bar "more than double normal", and calls a genuinely unusual midday bar ordinary.
How to compute intraday relative volume properly
Three steps, and the third one matters more than it looks.
The third step is what separates a measurement from a backtest artefact. If your baseline includes the session you are measuring — or worse, the whole history including the future — you have built something that looks brilliant in review and cannot exist live. Every number in this article uses a trailing 20-session median of that clock minute, excluding the current day.
Try it against the real curve:
So does the corrected reading make the sweep entry work?
This is the part we care about, and it is where we have to be careful, because a better measurement is not automatically a better trade.
The setup being tested is the one that keeps showing up on charts like the SPX example above: price coils, then a bar sweeps the lows of the coil and closes back inside — on abnormal volume for that minute. We defined it mechanically and pre-declared it before running anything:
consolidation   20-bar range in the bottom 40% of normal for that clock minute
sweep           bar's low breaks the prior 20-bar low AND closes back above it
volume          RVOL (time-of-day) >= 1.3 on the sweep bar
entry           the sweep bar's close
stop            beyond the sweep bar's low
horizon         60 minutes, path-ordered, STOP CHECKED FIRST
Out of 168,000 candidate bars, consolidation occurred on 17.5%, a sweep on 5.4%, and both together on 1.0% — roughly one signal every two sessions before the volume filter.
The result
The full setup returned −0.109 R per trade before costs, and the interval sits below zero. That is not a small edge. It is a small loss.
And the comparison that actually settles it — the identical setup with the volume condition inverted:
| Setup | n | E(R) | 95% interval | Win |
|---|---|---|---|---|
| Consolidation + sweep, loud (≥1.3×) | 356 | −0.109 | −0.212 … −0.006 | 44.7% |
| Consolidation + sweep, quiet (<1.0×) | 978 | −0.099 | −0.161 … −0.037 | 44.9% |
| Consolidation + sweep, any volume | 1,611 | −0.104 | −0.152 … −0.056 | 44.7% |
| Sweep alone, no consolidation filter | 9,014 | −0.075 | −0.096 … −0.054 | 46.3% |
| Random entry, same minute, same stop | 355 | −0.142 | −0.244 … −0.040 | 43.1% |
Loud sweeps and quiet sweeps returned the same thing. If abnormal volume carried the information, that is the row where it would appear, and it does not.
Nor is the relationship hiding in the tails
If loud bars mattered, expectancy should improve as volume rises. It does not — and the loudest bucket is the worst of all:
| RVOL (time-of-day) on the sweep bar | n | E(R) | Reached ≥2R |
|---|---|---|---|
| under 0.8× | 648 | −0.071 | 16.2% |
| 0.8 – 1.0× | 330 | −0.155 | 11.5% |
| 1.0 – 1.3× | 277 | −0.114 | 13.0% |
| 1.3 – 1.8× | 182 | −0.126 | 11.5% |
| 1.8 – 3.0× | 113 | −0.062 | 8.8% |
| over 3× | 61 | −0.145 | 4.9% |
The "break hard" outcome we were specifically looking for — a 2R run within the hour — happens less often after the loudest sweeps, not more.
Every variant we tried, including the ones that should have worked
We did not stop at the first null. Each of these was an attempt to rescue the idea by making the setup stricter in the way a discretionary trader actually would:
| Variant | n | E(R) | 95% interval |
|---|---|---|---|
| Base: consolidation + sweep + loud | 356 | −0.109 | ±0.103 |
| + closed in the top 40% of the bar (a real wick) | 207 | −0.105 | ±0.134 |
| + closed back above session VWAP | 253 | −0.062 | ±0.122 |
| + real wick and above VWAP | 143 | −0.096 | ±0.161 |
| + restricted to 10:00–11:30 | 63 | −0.111 | ±0.247 |
Then the exits, holding the entry fixed:
| Exit on the same 356 signals | E(R) | Win |
|---|---|---|
| Target 1R, stop 1R | −0.109 ±0.103 | 44.7% |
| Target 2R, stop 1R | −0.112 ±0.141 | 30.1% |
| Trail 1R | +0.036 ±0.145 | 36.2% |
| Hold 60 bars, stop only | −0.370 ±0.261 | 11.2% |
Explore any combination yourself — including the ones we did not run, which the tool will tell you it cannot answer:
What this refutes, and what it does not
We authorised ourselves to publish whatever came back, so here is the honest boundary of the claim.
What this study DOES rule out
A mechanical entry on SPY 1-minute bars — coil, sweep the low, close back inside, on abnormally high volume for that clock minute — did not produce a positive expectancy over 500 sessions, at any of the four exits tested, at any of the five strictness variants tested, in any of six volume buckets. With n = 356 and a per-trade standard deviation near 1R, the sample excludes effects larger than roughly ±0.1R. The version of this setup that gets taught — "wait for the trap, confirm with the volume spike, take the reversal" — is not supported at the size it is usually claimed. Costs are not even included; adding the spread moves every cell further left.
What this study does NOT rule out
It cannot rule out a small real effect hiding inside the intervals. It tests one instrument on one timeframe with one mechanical definition — and mechanical definitions are always a caricature of what a discretionary trader does. Our SPX example carried context this code never sees: the sweep happened beneath the slow cloud, price reclaimed session VWAP within minutes, and the day went on to trend. Those conditions are real and were not tested here. It also says nothing about other instruments, other timeframes, or a sweep used as an exit rather than an entry.
So what is relative volume actually for?
The measurement is genuinely worth fixing even though the entry did not survive — because a corrected reading is honest description, and description is what it was always good at.
| Use it for this | Not for this | |
|---|---|---|
| Reading | was this test of a level crowded or ignored? | — |
| Context | is the session participating today, or drifting? | — |
| Sizing | a level tested on 3× volume deserves a wider stop | — |
| Post-mortem | was I in a real move or an empty one? | — |
| Trigger | — | "volume spiked, therefore enter" |
| Confirmation | — | adding it to a setup that has no edge |
| Ranking | — | comparing a 15:55 reading to a 12:30 one on the naive method |
| Prediction | — | expecting a big bar to be followed by a big move |
That maps onto the same division of labour we use everywhere else: context tells you direction, location tells you where, structure tells you whether, and the candle tells you when — a sequence we work through in the scalp entry checklist, where volume sits in the confirmation layer rather than the trigger layer. If you want the decision to rest on something measurable, the boundary itself is a better anchor than the bar that touched it — see why price reverses at key levels.
The takeaway
- Fix the measurement. Compare a bar to the same clock minute from prior sessions, using a median, excluding today. Anything else is partly a clock.
- Expect the two readings to disagree — they did on 22.8% of bars, and the raw correlation between them was 0.05.
- Do not promote it to a trigger. Across 500 sessions the loud version of a coil-and-sweep entry returned −0.109 R and the quiet version returned −0.099 R. The volume condition did not separate them.
- Spend the attention on the exit instead. It moved the number more than every entry filter tested combined.
- Keep using it to read. Knowing a bar was 138% of a normal 10:59 is real information about who showed up. It just is not a reason to click.