INDICATOR · VWAP / Momentum
Oyamori True VWAP & Cloud Confluence
A VWAP fixed to its own timeframe, a five-cloud EMA stack, and a momentum engine — read as one verdict, with a hit-rate row scored on your own chart.
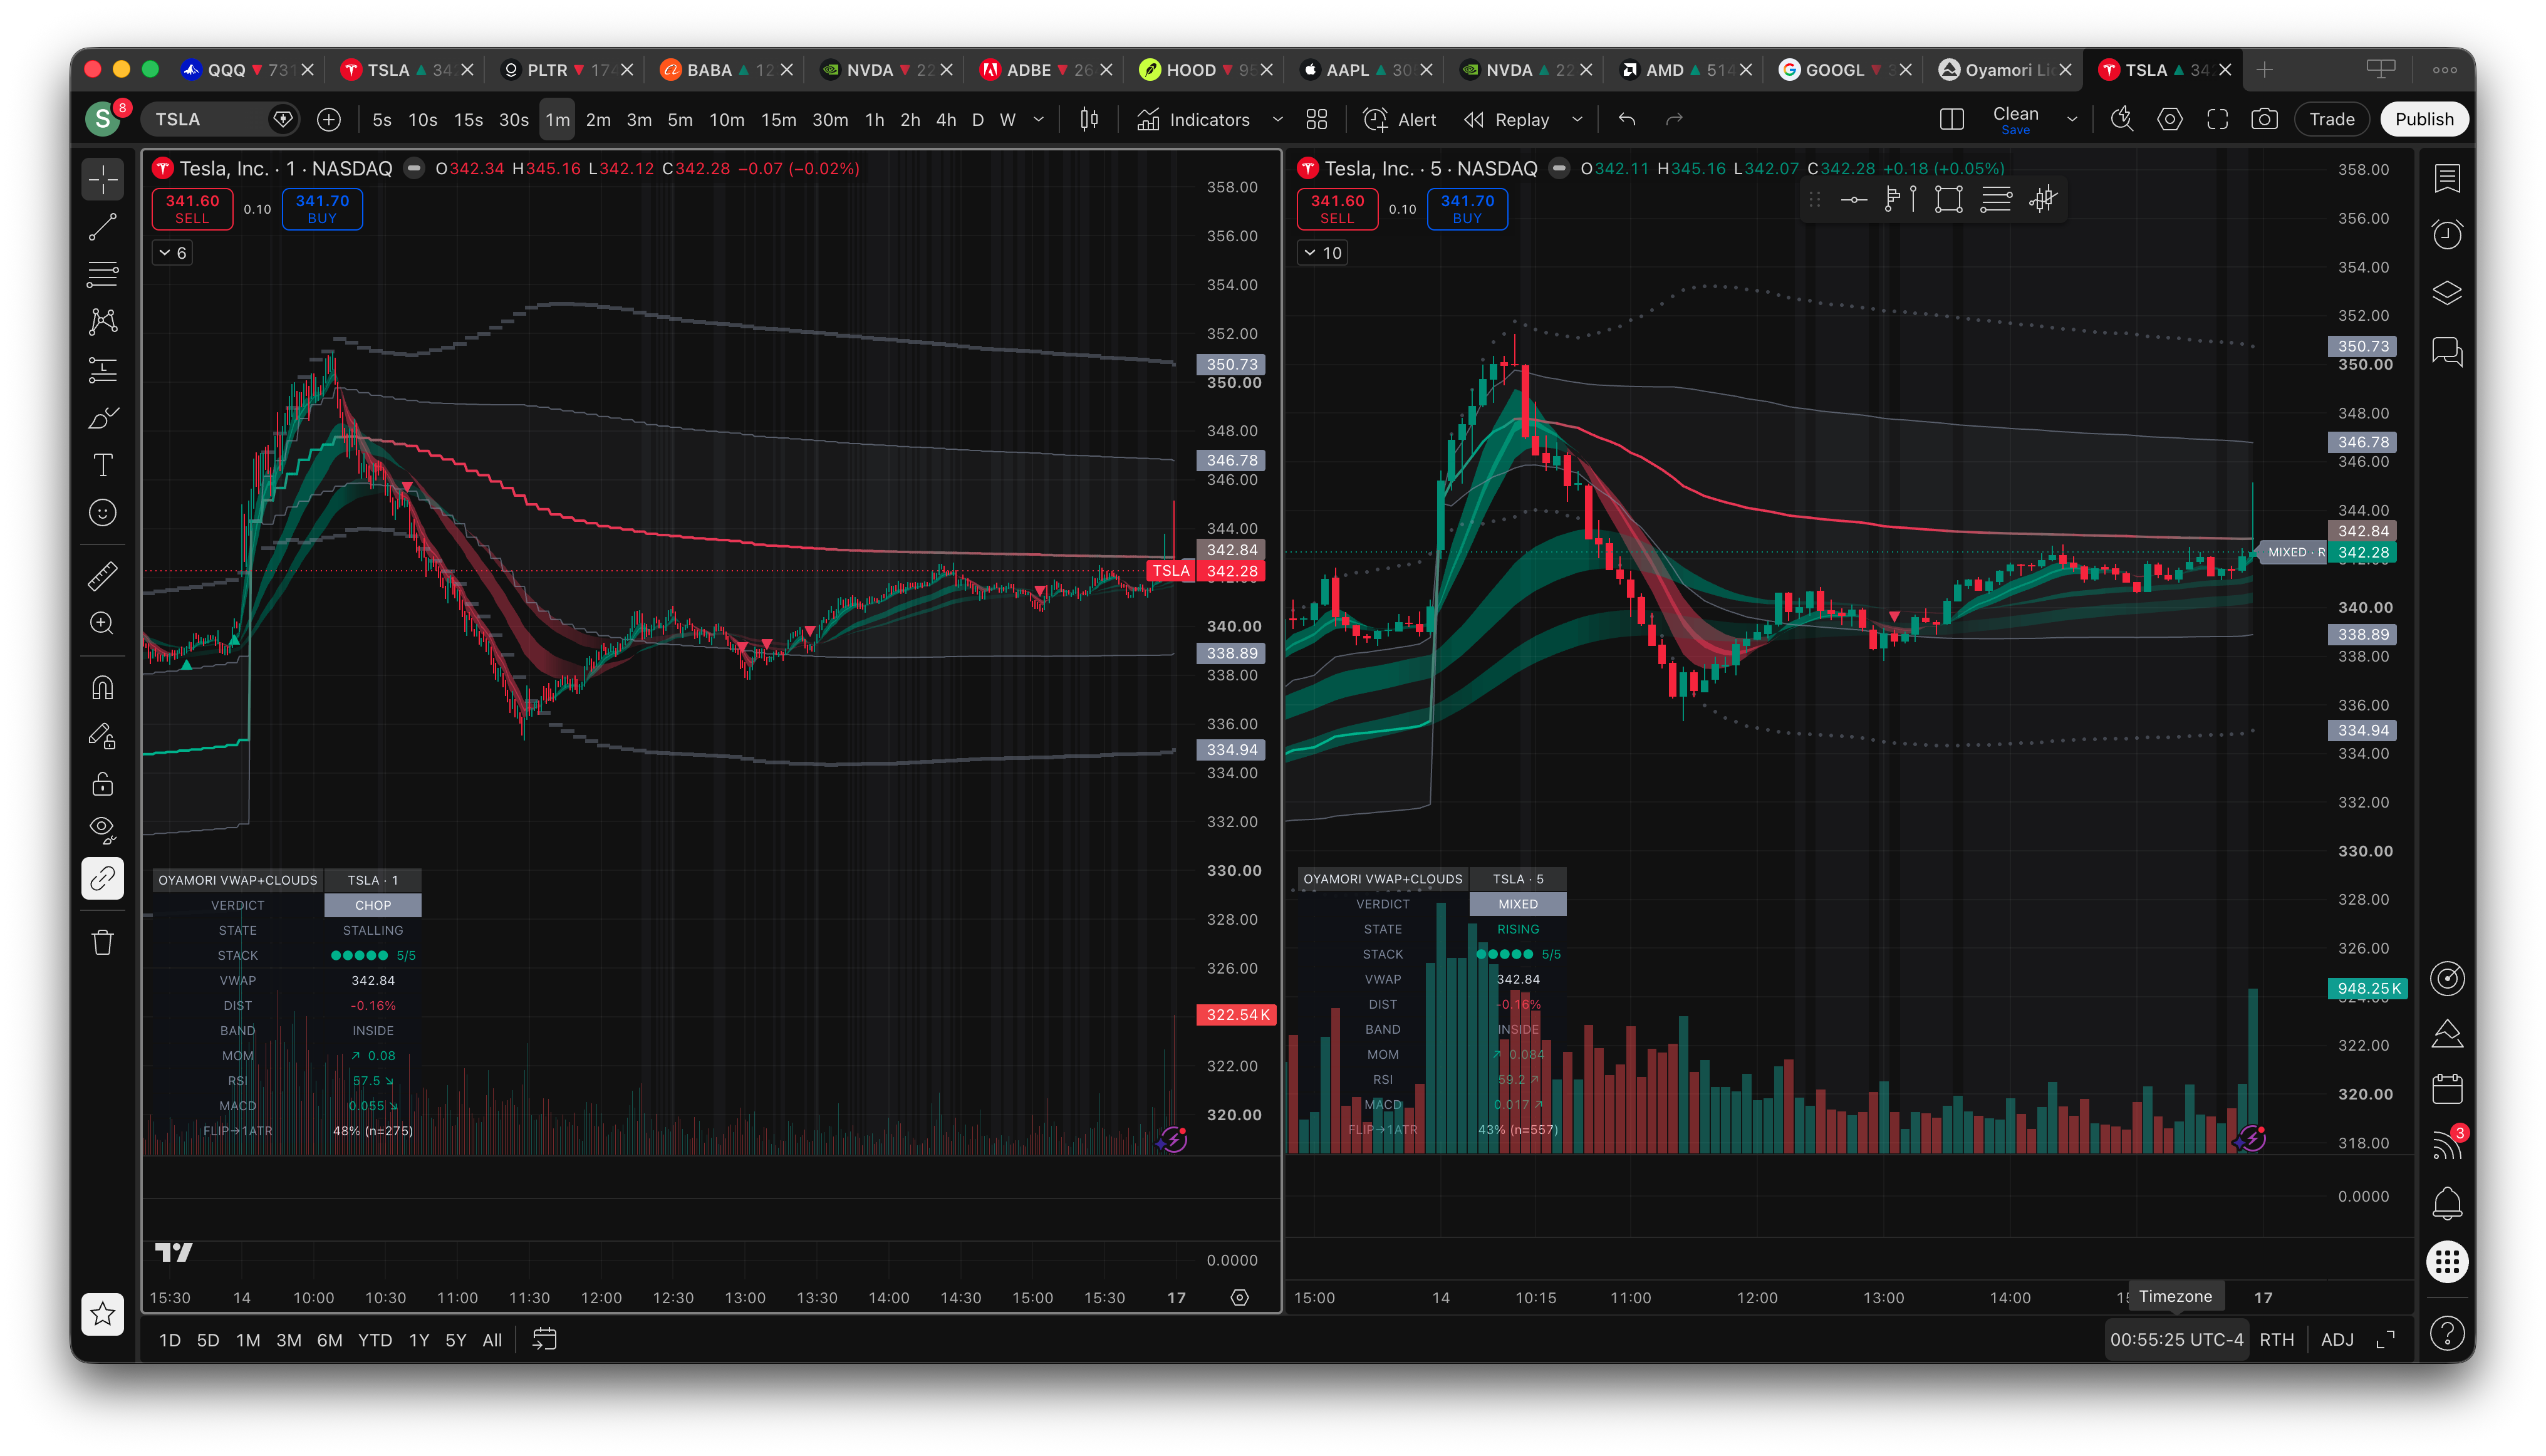
TSLA 1-minute (left) and 5-minute (right), same moment, same indicator. The True VWAP reads 342.84 on both — that is the whole point: the path is computed from a fixed source timeframe, so switching chart resolution does not move it. Note the two verdicts differ (CHOP on 1m, MIXED on 5m) because the momentum engine is reading each timeframe's own bars. Dashboard figures are in-sample, current-chart-only.
Oyamori True VWAP & Cloud Confluence answers one question: is this chart trending, and is it trending right now? A VWAP that doesn't change when you change timeframe, a five-cloud EMA stack, and a momentum engine — read together as one verdict, with a hit-rate row so you can check the verdict instead of trusting it.
Why "True" VWAP
An ordinary VWAP is computed from the bars you happen to be looking at, so its path changes when you switch chart resolution. Same symbol, same session, different line.
This one is computed from a fixed source timeframe (default 1m) regardless of the chart you're on. Drop from 5m to 1m to 15m and the VWAP stays exactly where it was — because it is exactly where it was. If you'd rather have the ordinary behaviour, one toggle turns it off.
- Anchors: Session · RTH Session (skips extended hours) · Week · Month
- Two deviation bands from the same sigma — the second one costs no extra data request
- Optional anchored VWAP from any point you drag on the chart
- The VWAP line itself heat-grades by price distance, so the line shows which side is in control
The Cloud Stack
Five EMA (or SMA) pairs — 8/9 · 5/12 · 34/50 · 72/89 · 180/200, the pairs popularised by ripster47 — each filled by direction. Two things make this stack different from the dozens of cloud scripts:
- Depth, not decoration. Clouds separate by a transparency ladder rather than five competing colour schemes, so the fast clouds sit visually in front of the slow ones.
- Opacity tracks momentum. A cloud solidifies while its own slope accelerates and fades as it dies. A flat stack recedes on its own instead of fighting price for attention.
The verdict
You choose which clouds must agree and whether price must be on the correct side of VWAP. The gate returns:
BULLISH / BEARISH — every gated condition agrees
MIXED — they don't
CHOP — price is inside the first band and momentum is stalling
OFF — you've gated nothing
A + or - suffix says whether aggregate momentum agrees with the verdict or is fading against it. Everything is measured in ATR-per-bar units, so a reading means the same thing on a $4 stock and a $400 one.
The STATE engine
Velocity and acceleration, z-scored against their own recent distribution and measured on different windows (a window compared with itself measures nothing):
RIPPING |
fast and still accelerating |
RISING |
trending up |
FADING |
still up, but decelerating |
STALLING |
no meaningful velocity either way |
BASING |
still down, but decelerating |
FALLING |
trending down |
DIVING |
fast and still accelerating down |
FADING and BASING are the two that pay for the whole engine — they mark the moment a move stops being a move, well before the verdict flips.
Self-validation
The dashboard carries a hit-rate row: of the VWAP flips this chart has printed, how many reached +1×ATR before price closed back through the VWAP.
It always prints its sample size, and it refuses to print a percentage below 10 samples — a thin sample shows n=4 (too few) rather than a confident-looking number built on four trades.
This is an in-sample, current-chart-only statistic. One symbol, one timeframe, whatever history your chart has loaded. It is not a backtest and not a forward-looking claim. It exists so you can find out whether this tool works on your instrument instead of taking my word for it.
Presets
One dropdown sets the anchor, source timeframe, visible clouds, gated clouds and momentum windows:
- Scalp — Session anchor, 1m source, clouds 1-2-3, fast windows
- Intraday — RTH anchor, 5m source, clouds 1-4, medium windows
- Swing — Week anchor, 60m source, clouds 3-4-5, slow windows
- Custom — every input back under your control
Nothing is locked. The raw inputs stay visible so you can see exactly what a preset chose and change your mind.
Dashboard & Alerts
- 8 positions, 3 sizes, a title row carrying symbol and timeframe so a screenshot explains itself
- Stack shown as
●●●○○— faster to read than a number - Optional floating verdict chip pinned at the last bar
- Rows: verdict · state · stack · VWAP · distance · band zone · momentum · RSI · MACD · hit rate
- 6 alert conditions worth their own entry (confluence bullish/bearish, VWAP reclaim/loss, RIPPING, DIVING), plus one bundled dynamic alert carrying cloud flips, STATE changes, 2σ band tags and chop onset in its message. Create a single alert with the condition "Any alert() function call" to receive those.
Honest Notes
- Empty states are real empty states:
—when the data isn't there, never a stale number. - The clouds are moving averages. They lag. That is what they are for — the VWAP and the STATE word are the fast half of this pairing.
CHOPis not a signal to fade; it's a signal to stand down.- The hit-rate row starts at
n=0on every new chart. It is measuring your instrument, not mine.
This is an analysis tool, not a trading system, and not financial advice. It does not predict price. Every number it prints describes what has already happened.
Author: Toni Maxx — Oyamori.com