Edges
When to Enter a Trade: The Confirmation Stack That Beats Guessing the Top
When to enter a trade is the question that separates traders who read a chart from traders who guess at it. The problem is almost never "can I short here" — the level is usually obvious. The real problem is "how do I know the pullback is finished and this is the best moment to enter?" Marking a red triangle at a resistance zone tells you where to watch; it does not tell you when to act. This deep dive uses a real two-timeframe AMZN chart to show exactly how a professional turns "price is at resistance" into a precise, confirmed entry — through a repeatable pipeline of liquidity sweep, displacement, structure shift, and retest — so you stop guessing the top and start letting the market prove itself first.
The difference between shorting the touch and shorting the confirmation is worth roughly 20–30% of your win rate. Here is how to capture it.
The triangle is "watch here," not "enter here"
Here is the actual setup — AMZN on the 1-minute (left) and 5-minute (right), the two red triangles marking the same supply zone we will dissect:
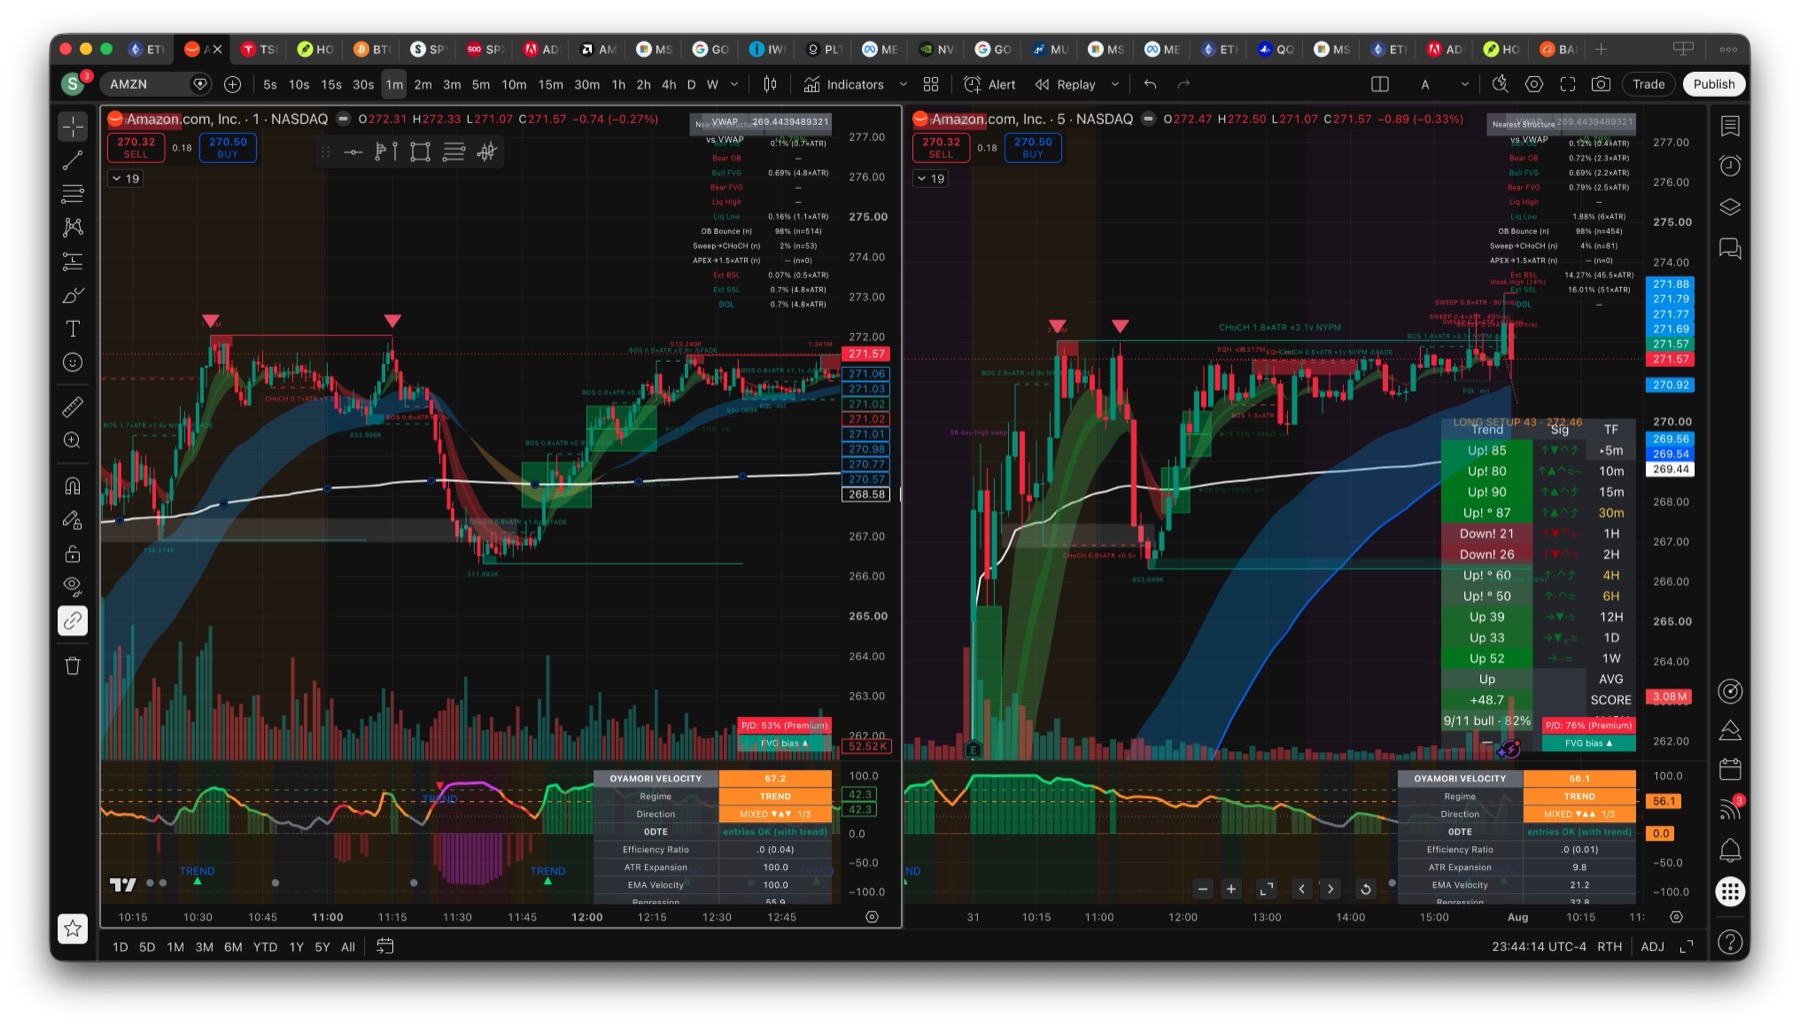
On the AMZN chart, two red triangles sit at the same supply zone around 271.8–272.0 — a double-top and a pool of buy-side liquidity. Both are correct places to look for a short. But they are opposite-quality entries, because of what the market had proven at each moment.
The mistake almost every developing trader makes is treating the resistance touch as the signal. It is not. A level being hit is the beginning of a setup, not the trigger. Price touching supply can just as easily be a pause before continuation as the start of a reversal — and until the market shows you which, entering is a coin flip. Retail sells at resistance; smart money waits. See the two approaches on the same double top:
Notice what happens at the second attempt: price sweeps above the equal highs, running the stops of everyone who shorted the touch, then drops. The retail trader had the right idea and still lost, because the timing came before the proof.
A setup is a state, not a "sell now" button
The mental shift that fixes this is to stop thinking of a setup as a single moment and start thinking of it as a lifecycle. A short does not go from "not a trade" to "trade" in one instant — it advances through stages, and you only fire at the last one. Advance a setup through its life and watch how early the touch really is:
Stage 2 — price reaching the point of interest — is exactly where the triangle sits, and exactly where retail shorts. But it is only armed, not ready. The setup still has to sweep the liquidity, break structure, and retest before it reaches Stage 6, SELL READY. Framing your setups this way stops the single most common error: firing at Stage 2 because price touched a line.
The entry pipeline — seven checkpoints
Here is the sequence that carries a setup from "armed" to "confirmed." Each step is the market giving you one more piece of proof that the sellers are actually winning. Walk the full pipeline — every step is mapped to the bar on the AMZN 1-minute chart where it happened:
The logic, in order:
- HTF bias — the higher timeframe (the 5-minute) must agree. You only hunt shorts when the bigger picture has lost momentum or broken down. Never fight the higher-timeframe draw, the discipline behind multi-timeframe analysis.
- Reach the POI — let price return to the supply zone, order block, or equal-high liquidity. Do not chase; let it come to you. This is the triangle.
- Liquidity sweep — price pokes above the high, grabs the buy-stops, and fails to hold, closing back below. This is the liquidity sweep — institutions take the stops first.
- Bearish displacement — a large red candle closing near its low, driving through the fast EMA cloud and leaving a small bearish fair value gap. This matters more than the triangle — it is the first hard proof of real selling.
- Market structure shift (MSS / CHoCH) — the displacement must break the last protected low, the base of the move that made the high. Only then has structure flipped from up to down.
- Retest — do not enter at the low of the displacement. Wait for the bounce back into the bearish FVG or broken level, then a rejection candle.
- Entry — sell the rejection, stop above the sweep high, targeting the liquidity below.
Turn "should I short?" into a number
If you want the pipeline as a discipline you cannot fudge, score it. Assign weight to each ingredient and only take the trade above a threshold — this is the quant version of the same idea. Tick what the setup actually has:
The scoring makes the honest thing unavoidable: a bare touch of resistance might score 20 (HTF bias plus reaching the POI) — nowhere near a trade. Add the sweep, the structure shift, and a retest into an FVG and you cross into genuine-edge territory. It is the same evidence-weighting logic as the tool-ranking framework, applied to a single entry.
The AMZN chart, bar by bar
Now put it on the real chart. The two triangles are the same zone but two completely different setups.
Triangle 1 (~10:34) — no trade
Price had just pushed up hard and tagged the high. There was a sweep, but that was all: no bearish displacement, no break of a protected low, no structure shift. A sweep with no follow-through is as likely to become a breakout as a reversal. Shorting here is guessing the top — and indeed, price only dipped, consolidated, and pushed back up to test the high again.
AMZN 1m — Triangle 2 Setup (Sweep → Displacement → MSS → Retest → Short)
Triangle 2 (~11:14+) — the valid short
The second time price returned to the zone, the full sequence played out:
- ~11:12–11:14 — price climbs back into the equal-high supply. The setup is armed.
- ~11:14–11:15 — the sweep bar tags the prior high, grabs the buy-stops, and closes back below.
- ~11:16–11:18 — a large red displacement candle drives down through the EMA cloud — the sellers' first real push.
- ~11:18–11:20 — that candle closes below the protected low from the ~11:08–11:11 base: bearish MSS.
- ~11:19–11:22 — a small bounce retests the bearish FVG and the broken EMA, then prints a rejection candle.
- After ~11:22 — the short from that rejection, stop above the sweep high, and price expands lower.
That is the entire pipeline on one chart: sweep, displacement, structure break, retest, entry.
Aggressive versus conservative entry
Two ways to take it, both valid:
- Aggressive — enter on the close of the displacement candle that confirms the MSS. Better price, but more risk of a snap-back before the retest. Stop above the sweep high.
- Conservative (recommended) — wait for the bounce back into the bearish FVG or broken EMA and a rejection candle, then enter. You give up a little price for far more confirmation, and the stop is tighter relative to the entry.
Either way, the entry comes after the market has proven the sellers are in control — never because price simply touched a line. That is the whole lesson: the triangle tells you where to watch, and the pipeline tells you when to act. The exact mirror for buying — a discount sweep into a bullish structure shift — is in when to enter a long. For the broader liquidity mechanics beneath both, see the liquidity candle and inducement.