ภายใต้ทุกสัญญาณระดับ A+ มีกลไกขับเคลื่อนเพียงหนึ่งเดียว นั่นคือ Oyamori Momentum Clouds หากคุณอ่านค่าสิ่งนี้ได้ถูกต้อง ส่วนที่เหลือของแดชบอร์ดจะอ่านค่าได้ด้วยตัวเอง แต่หากอ่านผิด สิ่งอื่นใดก็ไม่มีความหมาย Momentum clouds คือกลุ่มก้อน EMA-9 สองชุด — ชุดเร็วและชุดช้า — และแนวคิดเดียวที่ทำให้พวกมันทรงพลังคือ การ "flip" ไม่ใช่การที่ราคาตัดเส้น แต่คือ โมเมนตัมตัดโมเมนตัม บทเรียนนี้จะสอนว่า cloud คืออะไร การ flip หมายถึงอะไรกันแน่ และทำไมเหตุการณ์ cloud เพียงเหตุการณ์เดียว — นั่นคือ the cascade — จึงเป็นสัญญาณที่แท้จริง
หากคุณได้อ่านบันทึกของเราเกี่ยวกับ ระบบ EMA ที่กรองด้วยเทรนด์ คุณคงทราบแล้วว่า EMA ช่วยทำให้ราคาราบเรียบขึ้น แต่ cloud ก้าวไปอีกขั้นหนึ่ง นั่นคือการเปรียบเทียบ EMA เข้าด้วยกัน
Cloud สองชุด: จุดวกกลับ (the turn) และ แนวโน้ม (the trend)
Cloud ทั้งสองถูกสร้างขึ้นจาก EMA-9 ที่รับข้อมูลจาก timeframe ที่แตกต่างกัน:
- Cloud 1 · fast = EMA-9 จาก feed 1 นาที และ 3 นาที → สีเขียวนีออน / สีชมพูนีออน สิ่งนี้คือ "the turn" (จุดวกกลับ) ซึ่งจะ flip ก่อน
- Cloud 2 · slow = EMA-9 จาก feed 5 นาที และ 10 นาที → สีไซแอน / สีส้ม สิ่งนี้คือ "the trend" (แนวโน้ม) ซึ่งจะคอนเฟิร์มตามมา
บนกราฟ cloud ชุดเร็วจะวิ่งใกล้ราคาที่สุดและตอบสนองอย่างรวดเร็ว ส่วน cloud ชุดช้าจะอยู่ด้านหลังเพื่อเป็นบริบทที่ลึกกว่า เมื่อทั้งสองสอดคล้องกัน แสดงว่าแนวโน้มนั้นมีการสนับสนุนที่แท้จริง
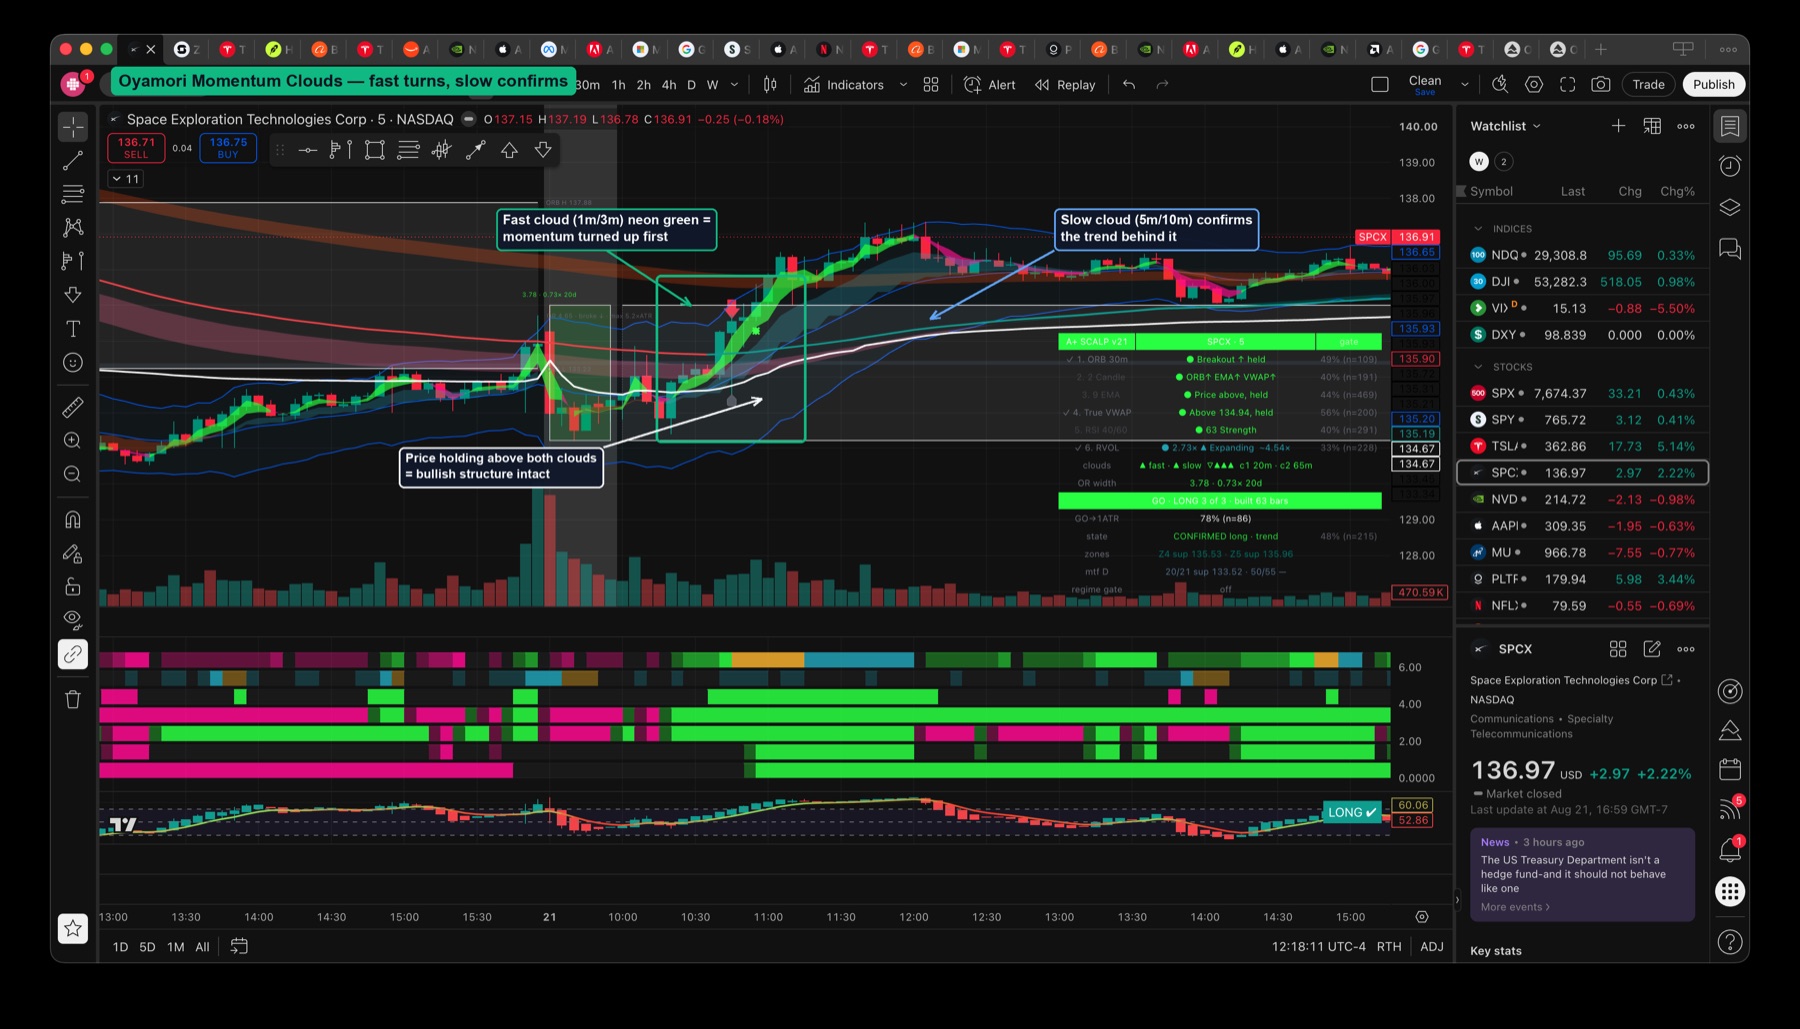
การ flip คือโมเมนตัมของโมเมนตัม ไม่ใช่การที่ราคาตัดเส้น
นี่คือแนวคิดที่อินดิเคเตอร์ส่วนใหญ่พลาดไป สัญญาณปกติจะเกิดขึ้นเมื่อ ราคา ตัดผ่าน EMA แต่การพลิกกลับของคลาวด์ (cloud flip) จะเกิดขึ้นเมื่อ EMA-9 เส้นหนึ่งตัดกับอีกเส้นหนึ่ง — คือเทรนด์ 1 นาทีที่กำลังแซงหน้าเทรนด์ 3 นาที นั่นคือการเปลี่ยนทิศทางของการเร่งตัวของเทรนด์ ไม่ใช่แค่ราคาไปแตะเส้น ซึ่งเป็นเหตุผลว่าทำไมมันถึงส่งสัญญาณได้ เร็วกว่า การทดสอบราคาเทียบกับ EMA ใดๆ ลองไล่เรียงขั้นตอนการกลับตัวเป็นขาขึ้นแบบเต็มรูปแบบและดูการสร้างลำดับเหตุการณ์:
เครื่องหมายที่คุณจะเห็นบนแผนภูมิ:
- C1 ▲ / ▼ — คลาวด์เส้นเร็วตัดกัน เป็นการอ่านค่าที่เร็วที่สุด
- C2 ▲ / ▼ — คลาวด์เส้นช้าตัดกัน เทรนด์เริ่มสอดคล้องกัน
- ★ Cascade complete — คลาวด์ ทั้งสอง สอดคล้องกัน จุดนี้จะใช้สีสัญญาณนีออน ไม่ใช่สีของคลาวด์ เพราะเป็นเหตุการณ์คลาวด์เพียงหนึ่งเดียวที่เป็นสัญญาณที่แท้จริง
ทำไมคลาวด์ถึงไม่ถูกหลอกในช่วงเปิดตลาด
การออกแบบสองประการที่ทำให้คลาวด์น่าเชื่อถือแม้ในช่วงที่วุ่นวายที่สุดของวัน:
- ป้อนข้อมูลตามเซสชันและเริ่มนับใหม่ (reseeded) เมื่อเปิดตลาด EMA จะเริ่มต้นใหม่ในทุกเซสชันปกติ ดังนั้นช่องว่างราคาที่เกิดขึ้นข้ามคืน (overnight gap) จะไม่ลากค่าเฉลี่ยที่ล้าสมัยมาใช้ในช่วงเปิดตลาด คลาวด์จึงถูกสร้างมาให้ทนทานต่อ Gap โดยธรรมชาติ
- เกตวอร์มอัป 3 แท่งเทียน สำหรับแท่งเทียนไม่กี่แท่งแรกหลังการเริ่มนับใหม่ คลาวด์อาจจะ วาดเส้น แต่จะยังไม่ ส่งสัญญาณ — เนื่องจากยังไม่มีข้อมูลเพียงพอที่จะมีความหมาย สิ่งนี้เป็นระเบียบวินัยแบบเดียวกับการรู้ว่า เมื่อใดที่ระดับราคาได้ก่อตัวขึ้นจริง เทียบกับเมื่อใดที่มันยังคงเป็นเพียงสัญญาณรบกวน (noise)
ข้อมูลเพิ่มเติมที่อ่านได้ง่าย: cloud gap (ระยะห่างระหว่างคลาวด์) แสดงถึงความแข็งแกร่งของเทรนด์ และ cloud thickness (ความหนาของคลาวด์) แสดงถึงความไม่สอดคล้องกันของข้อมูล — คลาวด์ที่บางคือความเห็นพ้องที่เปราะบาง
สิ่งที่คลาวด์บอกคุณ — และสิ่งที่ไม่บอก
Clouds คือเครื่องมือวัดโมเมนตัม และมันยอดเยี่ยมมากในสิ่งที่มันทำ นั่นคือการแสดงให้คุณเห็นถึงการกลับตัวตั้งแต่เนิ่นๆ และแนวโน้มที่อยู่เบื้องหลัง สิ่งที่มัน ไม่ใช่ คือตัวจุดชนวนการเทรด (trade trigger) การพลิกกลับ (flip) บอกคุณว่าโมเมนตัมเปลี่ยนทิศทางแล้ว แต่มันไม่ได้บอกว่าราคาอยู่ในตำแหน่ง ไหน ของกรอบราคา, มีการกวาดสภาพคล่อง (liquidity swept) ก่อนหน้านี้หรือไม่, หรือมีปริมาณการซื้อขาย (volume) สนับสนุนการเคลื่อนไหวนั้นหรือไม่ หน้าที่เหล่านี้เป็นของ gates และ state machine ในบทเรียนถัดๆ ไป สำหรับตอนนี้ ขอให้เรียนรู้วิธีอ่าน clouds ให้คล่องแคล่ว — การกลับตัวที่รวดเร็ว, การยืนยันที่ล่าช้า, cascade หมายถึงทั้งสองอย่างเห็นพ้องตรงกัน — เพราะสัญญาณหลังจากนี้ทั้งหมดถูกสร้างขึ้นบนพื้นฐานของการอ่านค่านี้
บทอ่านที่เกี่ยวข้อง
- Trend-Filtered DCA with EMAs — พื้นฐาน EMA ที่ clouds นำมาขยายต่อ
- Momentum + Volume: A Trading Edge — ทำไมโมเมนตัมถึงต้องการ volume สนับสนุน (บทเรียนที่ 5)
- Reading Market Direction with Trendlines — การดูทิศทางแบบคลาสสิก เพื่อการเปรียบเทียบ
- Market Structure Hierarchy — วิธีที่ higher timeframe กำหนดกรอบการกลับตัวในไทม์เฟรมที่ต่ำกว่า
- Liquidity Sweep Trading — สิ่งที่ต้องเกิดขึ้น ก่อน ที่การพลิกกลับ (flip) จะน่าเชื่อถือ
ถัดไป: บทเรียนที่ 3 — การอ่านแดชบอร์ด, ซึ่งเฉดสีจะบอกคุณว่า คืออะไร และความโปร่งใสจะบอกคุณว่า มั่นใจแค่ไหน