Edges
Power Hour Trading: Reading the Closing-Bell Sell-Off
Power hour trading is built on a real observation almost every day-trader eventually makes: in the last 30 minutes before the close, price often gets sold down into the bell. That drift is not superstition — it is the product of forced, mechanical order flow that only exists in the final hour. But there is a trap hiding inside the observation, and it is expensive: the closing move is not always down. This deep dive explains exactly what drives the closing-bell sell-off, and gives you a validation gate to filter out the days that fade the other way — so you trade the setup, not a superstition.
The honest one-liner up front: the last hour is a distinct, flow-driven regime; the fade is real on distribution days, but its direction is set by the closing imbalance, not by the clock. Get that distinction right and this becomes an edge. Get it wrong — "it always drops at 3:30, so I short" — and you hand your account to the days it rips higher instead.
Why the close is a forced-flow regime
The final hour behaves differently because a specific set of participants must trade then, for reasons that have nothing to do with the chart:
- Market-on-Close (MOC) imbalances. Index funds, ETFs and institutions execute at the 4:00 closing auction — the single largest liquidity event of the day. Their orders lock by ~3:45–3:50 ET, and if one side is bigger, market makers pre-hedge into the last minutes, dragging price that way. This is the biggest driver.
- Day-trader and prop flattening. Desks close positions before the bell to avoid overnight risk. After a long-biased day, that flattening is selling.
- Leveraged-ETF rebalancing. Leveraged and inverse ETFs rebalance near the close in the direction of the day's move — so a down day gets its selling amplified into the bell (and an up day gets its buying amplified).
- 0DTE and dealer gamma hedging. Option-dealer hedging (charm and gamma) accelerates whatever is already happening in the last hour.
None of these is a chart pattern — they are plumbing. And they arrive on a schedule. Tap through the closing hour to see the sequence:
The decisive moment is ~3:50 ET, when the auction imbalance publishes. Everything before it is positioning; that print is the tell.
The myth of "always down"
Here is the trap. Notice that two of the four drivers above are direction-neutral — leveraged-ETF rebalancing amplifies whichever way the day went, and the MOC imbalance can be net buy just as easily as net sell. The reason a trader "always sees" selling into the close is selection bias: they remember the distribution days and forget the days price ramped.
The closing drift follows the imbalance. Flip the cases and watch the same last hour go up or down:
Whole categories of days skew the imbalance to the buy side and rip the close higher: month-end and quarter-end rebalancing, index-reconstitution days, many OPEX Fridays, and strong risk-on trend days. On those, shorting at 3:30 because "it always fades" is the losing side of the trade. That is exactly why you need a gate.
The validation gate — filter out the days that don't fade
Before you ever take a closing short, run the day through a two-layer gate. Layer A is hard vetoes: any single one true, and you stand down — because a structural buy flow can lift the close no matter how bearish the chart looks. Layer B confirms it is a genuine distribution day. Only a clean Layer A and a stacked Layer B — capped by the net-sell imbalance — is a trade:
Read the two layers as a filter, not a scoreboard:
- Layer A · Hard vetoes (ANY → stand down): month/quarter-end or index rebalance · triple-witching / OPEX · strong up-trend day (above a rising VWAP, higher highs) · risk-on tape (indices green, VIX down) · a catalyst into or after the close · MOC imbalance prints net BUY.
- Layer B · Distribution confirmations (need the stack): a rejected weak high / failed breakout · lower highs or a bearish CHoCH · price below or rejecting VWAP · weak broad tape (indices red, VIX up) · distribution volume (dry bounces, heavy drops) · MOC imbalance prints net SELL — the trigger.
The gate exists to make the "no" easy. Most days are not clean closing fades, and the discipline that keeps you out of a buy-imbalance ramp is the same discipline that makes the real fades pay.
A distribution day into the close — the NVDA example
Here is the observation in the wild — NVDA on the 5-minute (left) and 10-minute (right), late session:
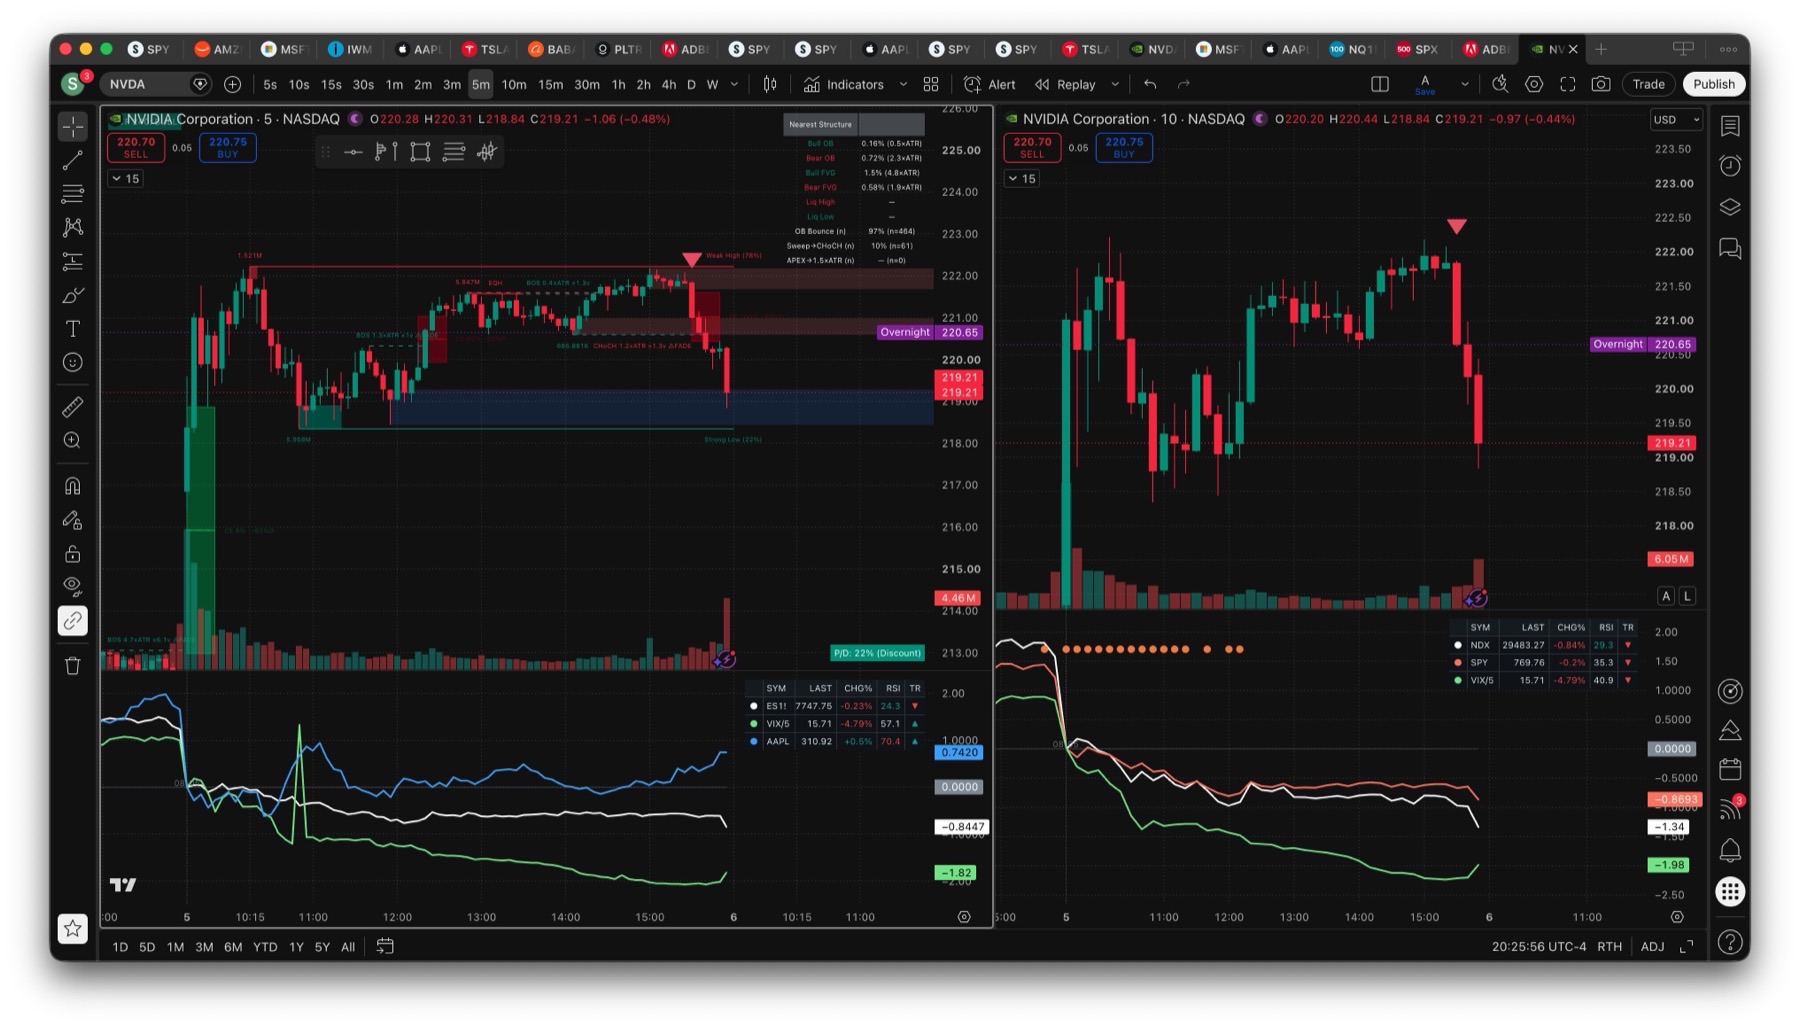
Run it through the gate: no obvious veto (not month-end, tape risk-off, no up-trend), and Layer B stacks — rejected weak high, bearish CHoCH, price in discount below VWAP, weak indices. On a day like this a net-sell imbalance is the green light. The move is the mechanical result of the fingerprint, not a coincidence of the clock.
Trading it, bar by bar
The schematic — a rejected high, an afternoon distribution range, then the imbalance-fuelled flush:
Weak-High Rejection → Distribution → Closing Flush
The execution, once the gate is green:
- Entry — short the break of the intraday range low / VWAP as the imbalance confirms net sell (~3:45–3:50). Don't pre-empt the imbalance; let it print.
- Stop — above the rejected weak high (or the last swing high). If price reclaims VWAP, the distribution thesis is wrong — exit.
- Target — the prior-day low or the session-low extension. Cover into the 4:00 auction rather than holding for the exact print; the move is largely done by the bell.
- Stand down mid-trade — if the imbalance flips to buy or no flush appears by ~3:50, the window is closed. No trade beats a forced one.
This is the closing-hour expression of the same short entry pipeline — a rejected high, a structure break, a confirmed trigger — timed to the one part of the day when forced flows do the work for you. It slots directly into the Closing auction phase of the session clock; the whole Session Clock hub shows where it sits in the trading day.