Edges
Breakout Options Execution on M1: Entry, Structural Stop, Runner

Photo by Chris on Unsplash
Breakout options execution on M1 is a different problem from spotting the breakout. The detection part is covered elsewhere on this site; this article is about what happens after the candle closes beyond the edge: why some breaks run without ever looking back while others come straight back to the line, what a sideways box does to the trade, which of five entry models to use, where the structural stop belongs and what it costs in premium, and how a two-contract position turns one decision into a scale and a runner.
Everything here that carries a number was measured. The centre of the article is a study of 8,657 M1 breakouts on SPY, QQQ, IWM, TSLA and AAPL across 308 ticker-days from the Oyamori tick archive, and it refutes one of the ideas this article was originally going to teach. The refutation is kept in, because the version of the rule that survived the data is the one you should trade. The worked example uses a live SPY 0DTE chain pulled the same afternoon, and the sideways example is a real SPY session, annotated on both the trader's own chart and a clean render of the same bars.
If you want the detection side first, read Breakout Scalp Entry: Price Action Leads and the free Breakout Engineering course. This article starts where they stop.
Why a breakout runs: the order flow behind the candle
A boundary on an M1 chart is not a line. It is a place where three kinds of orders have accumulated. Stops from the people who sold into the range and are wrong if price leaves it. Resting limit orders from people who want to sell there because it has held before. Pending buy orders from breakout traders waiting for a close above it. When a bar closes beyond the edge, the first group is forced to buy, the third group buys by choice, and the second group is the only supply. If the second group is thin, price has nothing to trade against above the line and moves through empty book until it finds the next cluster of sellers. That vacuum is the impulse, and the fake-breakout study on this site measured it: even the failed breaks pay a third of a run for about four minutes, because the vacuum is real whether or not follow-through arrives.
What happens next depends on who is left. If the stops were deep and the breakout attracted new buyers, nobody has a reason to sell at the old edge and price never comes back to it. That is the no-test run. If the breakout was thin, the earliest buyers take profit into the first resistance, price drifts back to the line, and the people who missed the exit sell it there. That is the retest, and whether the retest holds is a second decision, not a continuation of the first.
Index options add a mechanism single stocks do not have. On heavy 0DTE days, dealers who sold calls near the money are short gamma: as SPY rises through a strike, they must buy the underlying to stay hedged, which pushes SPY further, which makes them buy more. A breakout that crosses a strike with a large call open interest can get a tailwind that has nothing to do with the chart. The reverse is also true, and it is one reason index breakouts on M1 can extend further than their volume justifies and reverse harder when the hedging flips.

No-test versus retest: what the study found decides it
The archive study defined a breakout as an M1 close beyond the prior 20-bar high or low, then followed each one for 10 bars. A run is a move of at least 1.5 ATR beyond the level. A retest is a return to within 0.1 ATR of the level. A failure is a close back inside within the 10 bars.
The base rate is sobering and it is the same across all five tickers: 40–46% of breakouts run at least 1.5 ATR, and 70% close back inside the box at some point in the next 10 bars, with a median of two bars until they do. Only one break in eight runs without ever coming back to the line. Of the breaks that do run, 71% touch the line first. That single number settles a lot of arguments about entry timing, and it comes back in the entry section.
The question this article set out to answer was what separates the 43% from the 57%. The study tested every candidate that the sideways-context theory predicts should matter, and then the breakout candle itself.
| Feature at the break | Bucket | n | Ran ≥1.5 ATR | No-test run |
|---|---|---|---|---|
| Box height (compression) | under 4 ATR | 3,605 | 44% | 13% |
| 4–7 ATR | 4,546 | 42% | 12% | |
| 7 ATR or more | 506 | 41% | 11% | |
| Position in the 2-hour range | beyond the extreme (open air) | 2,672 | 42% | 12% |
| wall within 1.5 ATR | 1,139 | 43% | 14% | |
| mid-range (boxed) | 4,846 | 43% | 12% | |
| Time of day | 09:30–10:30 | 992 | 40% | 12% |
| 12:00–14:00 | 2,817 | 43% | 12% | |
| Volume trend into the edge | falling | 2,666 | 43% | 12% |
| rising | 2,475 | 42% | 12% | |
| Edge touches in the box | 2 or fewer | 6,751 | 42% | 12% |
| 5 or more | 158 | 47% | 22% | |
| Break bar body | under 40% of range | 850 | 31% | 5% |
| 60% or more | 6,127 | 46% | 15% | |
| Break bar rejection wick | over a third of range | 1,400 | 36% | 7% |
| under a fifth | 5,631 | 45% | 14% | |
| RVOL on the break bar | under 1.0× | 2,698 | 37% | 9% |
| 1.5× or more | 2,991 | 49% | 16% | |
| 2.5× or more | 726 | 55% | 18% |
Read the top half of the table and then the bottom half. Every context feature is flat: compression, room in the higher-timeframe range, time of day, volume trend, how many times the edge had been tested. The 95% confidence intervals on the big buckets are about two points wide, and none of those differences clears them. The "known boundary" idea, that an edge tested five times has limit sellers stacked on it and absorbs the break, did not survive: the 5-plus-touch bucket ran slightly more often, not less, though at n=158 the interval is wide enough that the honest reading is "no penalty found."
The bottom half is where the information is. Body, wick and volume on the break bar itself move the run rate from 31% to 55%, and the no-test rate from 5% to 18%. Stack them, and a bar with a body of at least 60%, a rejection wick under 20% and RVOL of at least 1.5× ran 55% of the time and never looked back one time in five (n=1,629; per ticker, 52–62%). A bar that fails any one of those tests ran 37% of the time and was back inside within four bars 60% of the time.
What the sideways actually changes: dollar room, not odds
The plan for this section was to teach that a quiet sideways box kills breakouts. The trader's own SPY chart from the afternoon of 2026-09-17 looks like the perfect illustration: from 12:00 the index sat in a 1.19-wide box for two hours, tested the top edge ten times in 38 minutes, produced ten breakout closes by the same rule the study uses, and every one of them came back. The morning, by contrast, had breaks that ran 3.9 ATR and 2.7 ATR.
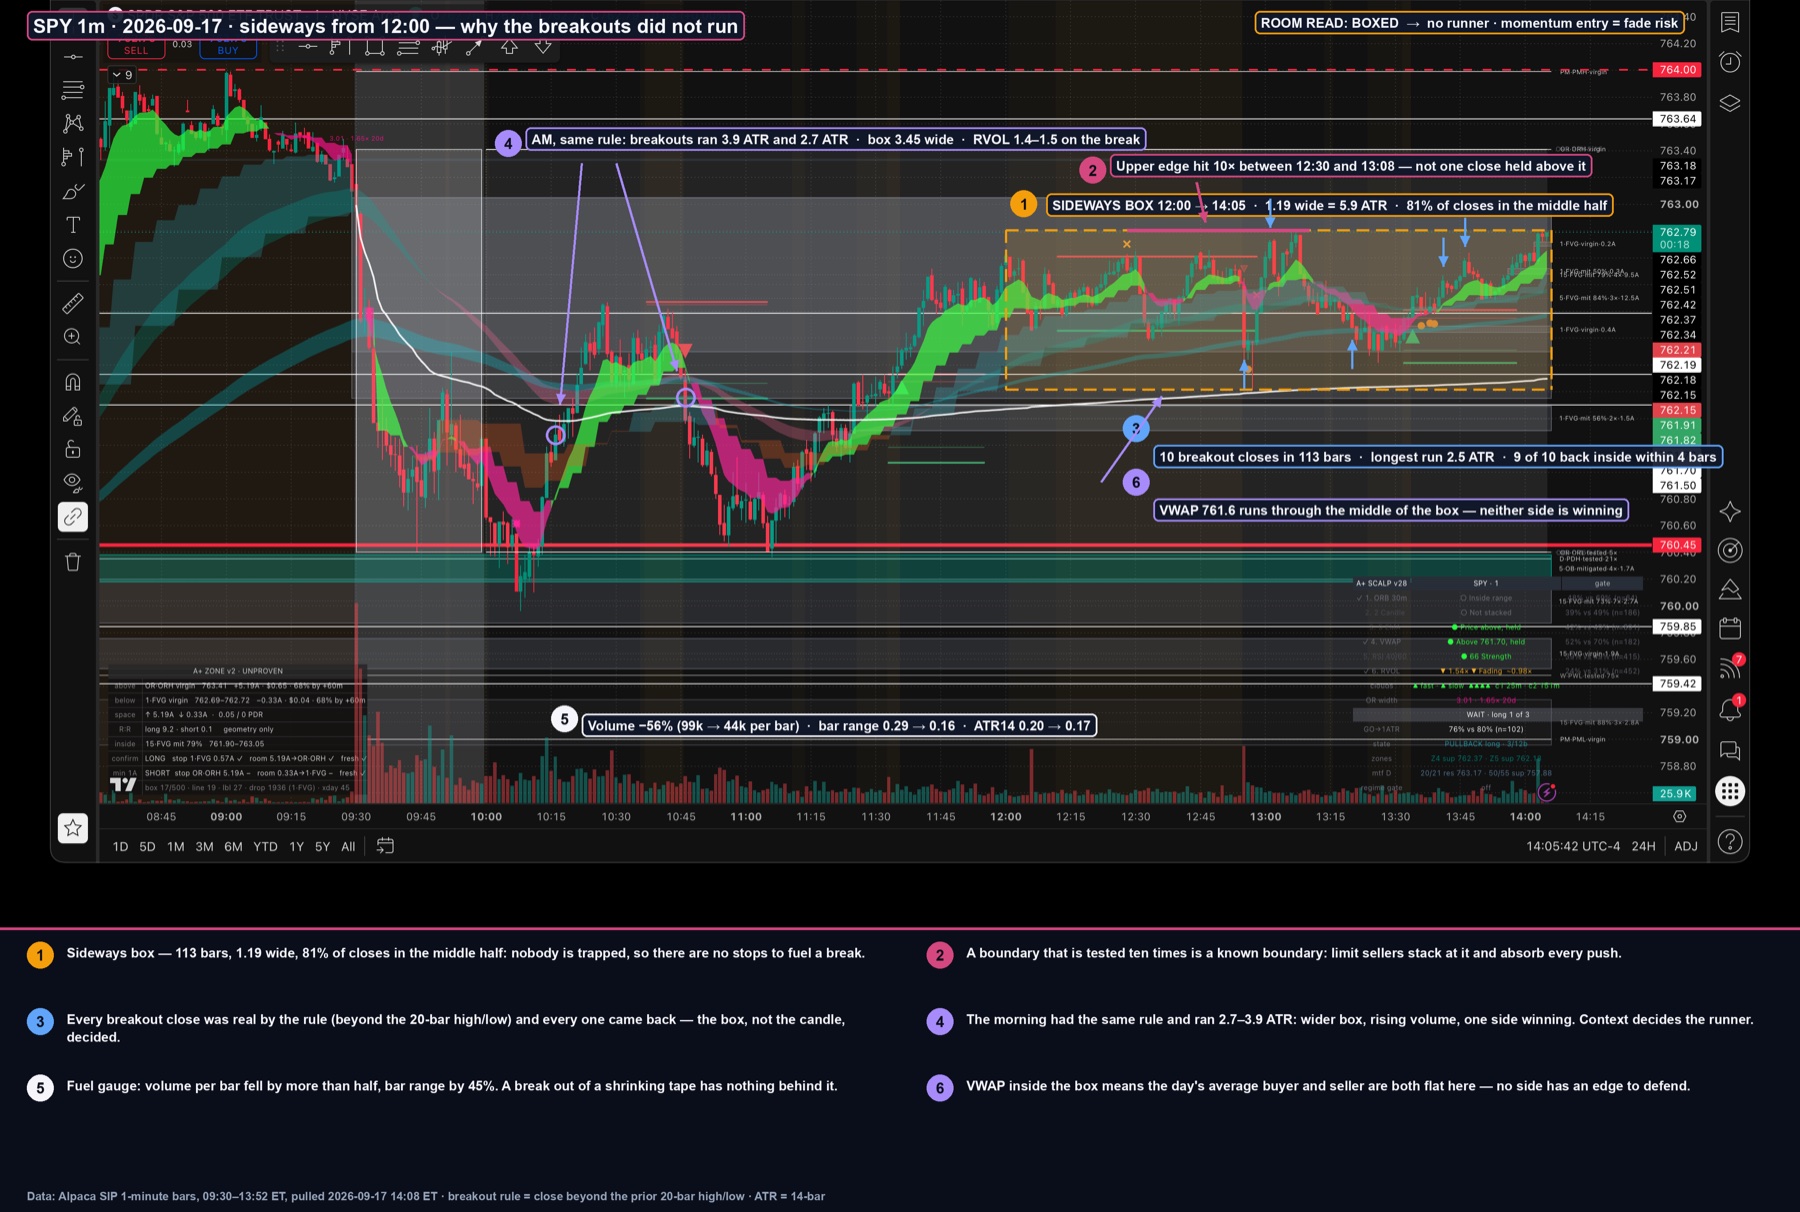
Then the study came back flat on box height, range position and time of day, and the chart has to be read again. Two of those ten afternoon breaks did run 1.5 ATR or more by the study's definition: the 12:55 downside break travelled 2.5 ATR before returning and the 13:20 break 1.9 ATR. That is two in ten against a base rate of four in ten, on a sample of ten, which is not evidence of anything. What the chart does show, unambiguously, is in the fifth callout: the average bar range fell from 0.29 in the morning to 0.16 in the afternoon, volume per bar fell by more than half, and ATR14 went from 0.20 to 0.17.
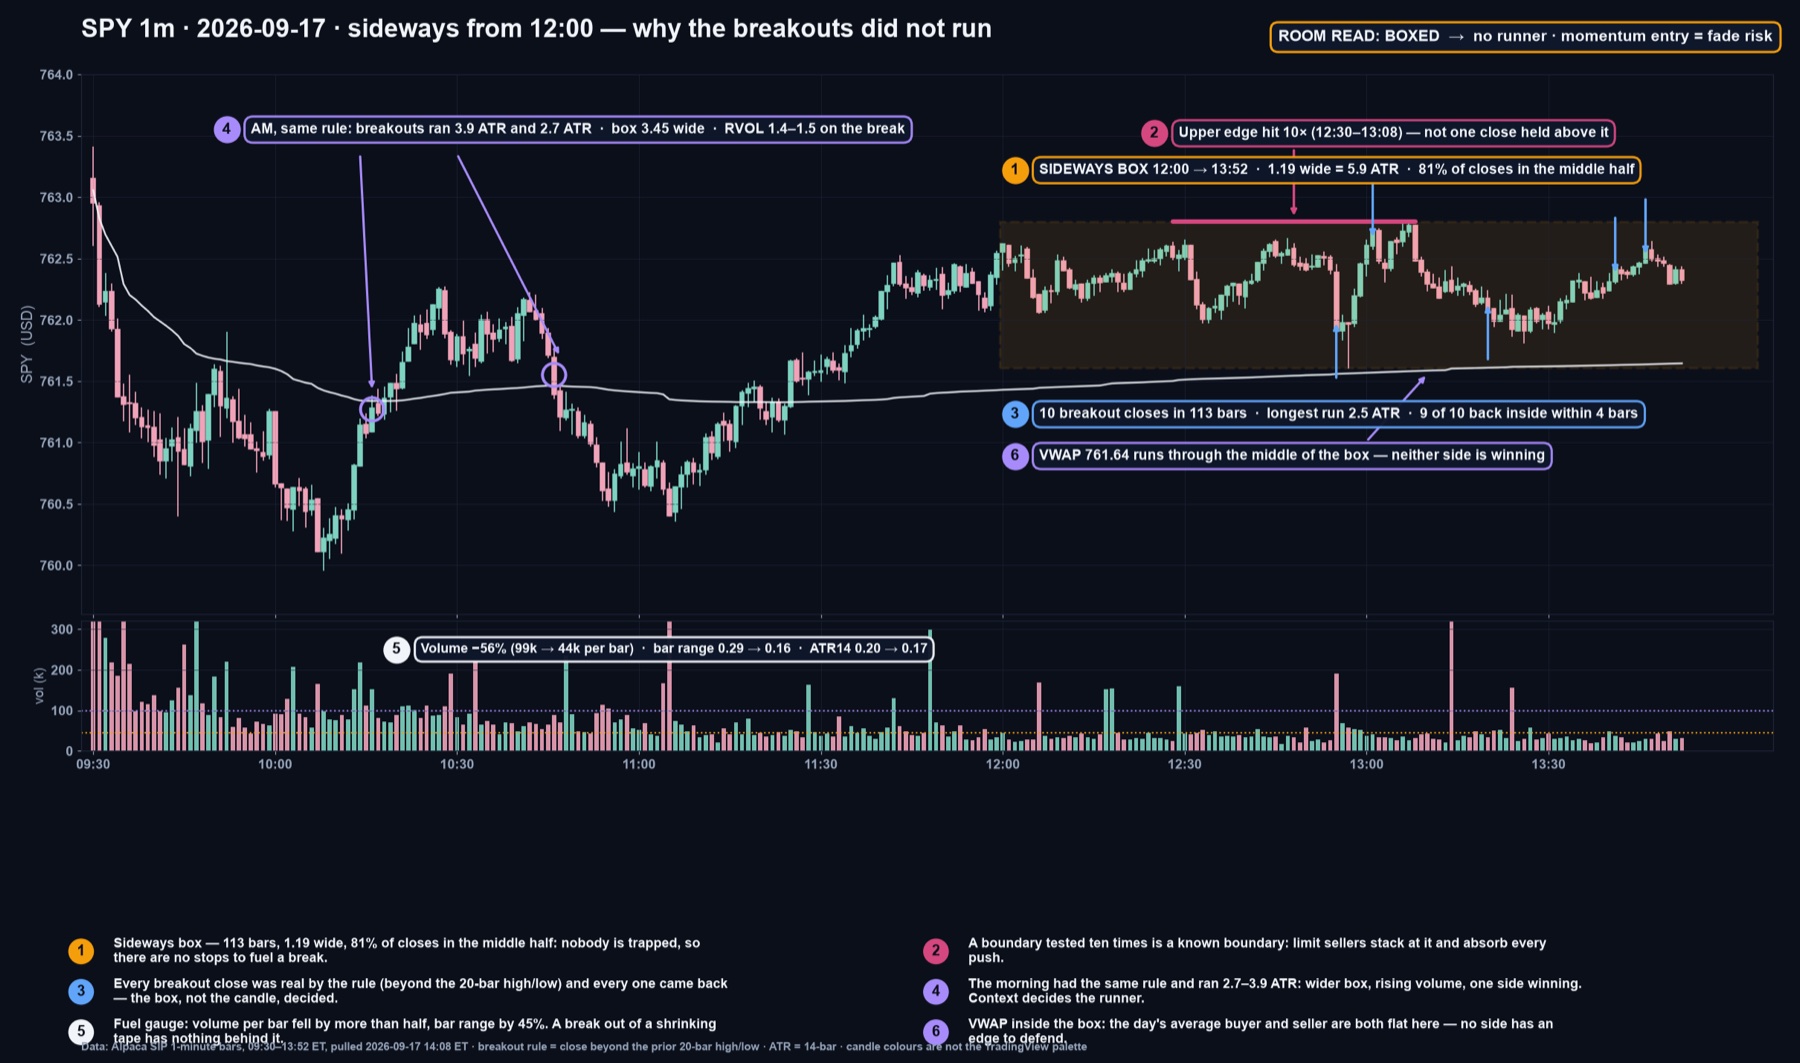
That is the real effect of the sideways, and it matters more for options than for stock. The study measures runs in ATR because that is how the chart measures them. An option measures them in dollars, and the dollar value of an ATR collapses through the day. Across the same 68 sessions, the median M1 ATR14 on SPY was 0.39 in the first hour, 0.30 in the late morning, 0.20 at midday and 0.19 in the afternoon; on QQQ it went from 0.73 to 0.27. The median 20-bar box shrank the same way, from 1.76 to 0.81 on SPY.
So a 1.5 ATR run, the event the study counts as a success at the same 43% rate all day, is worth about 0.59 on SPY in the first hour and about 0.29 at midday. In the session on the chart, a 1.5 ATR run in the late morning was worth about 0.45 and the same run in the afternoon box about 0.25. Against a 0DTE call with a delta near 0.45, the morning run moves the premium by roughly 0.20 and the afternoon run by roughly 0.11, before theta. On a contract that was bid 0.39 and offered 0.40, the afternoon run barely clears one spread, and if you traded two contracts and scaled one at the first target, the runner has almost nothing to run into.
So the rule survives, with a correction. The sideways box does not tell you whether the break will run. The break bar tells you that. The sideways box tells you whether a run is worth trading in options, through one number: ATR in dollars against the option's spread. If 1.5 ATR is less than three times the bid-ask spread of the contract you would buy, the setup is not tradeable in options no matter what the bar looks like, and the honest reading of the SPY afternoon is that it was a stock scalper's box, not an options one.
The other thing the sideways can still do is put a wall in the runner's way. If the M1 break is inside a larger M15 range, the far edge of that range is where the early buyers take profit. The study found this did not change the odds of a 1.5 ATR run, but a runner that is supposed to trail for 3R needs 3R of room, and a wall one ATR away is a fixed target, not a trail. The room read is therefore not "will it run" but "how far can the runner go": open air, one wall, or boxed, and the answer sets the exit rule before you enter.
The five entry models, with the study's numbers on them
Every entry model is a different answer to the same trade-off: get in early and eat the fake-outs, or wait for confirmation and miss the runs that never come back. The study puts a number on each side. Of the runs, 71% touched the edge first and 29% did not. Of all breaks, 70% closed back inside within 10 bars.
E1 — Momentum-candle entry. Buy the close of the first bar beyond the edge, when that bar has a body of at least 60%, no rejection wick and RVOL of at least 1.5×. Stop a little inside the box. This is the entry that owns every no-test run, and it is the entry the trader asked about. With the stop 0.25 ATR inside the edge, E1 reached 1R before the stop 45% of the time and 2R 30% of the time across all breaks. On the momentum-bar subset the ATR-run rate rises to 55%, but the R-multiples do not improve, because a bigger bar puts the entry further from the level and widens the stop: the median stop for a full-bodied bar is 0.65 ATR against 0.44 for a small one. That is the cost of E1 stated plainly: you buy the best bars at the worst price.
E2 — Impulse-high continuation. Wait for the next bar to take out the momentum candle's high, and put the stop under that candle rather than inside the box. The stop is tighter than E1 whenever the candle is large, and the first bar that fails to make a new high keeps you out of the fastest fake-outs. The study did not measure E2's fill rate; it is between E1 and E3.
E3 — Retest limit. A resting limit order in the upper part of the box, stop below the edge. It fills on the 71% of runs that come back to the line and misses the 29% that do not. In exchange it has the best R of the five, because the entry is at the level, not above it. The fill happens in the same two-bar window in which most fake-outs are also declaring themselves, so the retest limit needs the acceptance read from the room checker below: a pause above the edge fills you into a hold, a leak fills you into a failure.
E4 — VWAP-hold reclaim. A retest that holds both the edge and VWAP, entered on the bar that reclaims the box high. The fewest fills of the five and the cleanest structure: when the day's average buyer is defending the same line as the box, both groups have to be wrong for the stop to hit.
E5 — Second-break entry. The first break is absorbed and closes back inside; the second break, a few bars later, is bought. The theory was that the limit sellers at a known boundary get used up on the first attempt. The study's flat result on edge touches means that theory is unproven, and E5 stays in the list as a way to re-enter a box you were stopped out of rather than as an edge in its own right.
The decision rule that follows from the numbers: if the break bar passes all three tests (body, wick, volume) and the dollar room clears the spread, take E1 or E2 now, because one run in five never comes back and the momentum profile doubles that share. If the bar fails any test, do not chase; put the E3 limit in and let the 71% come to you. If the bar fails and the tape has shrunk, skip, and the next box is minutes away.
The structural stop, and what it costs in premium
The stop belongs a little inside the box, not on the edge and not a fixed number of cents away. The edge is where the wick sweeps land: the study's median failure is a close back inside within two bars, and the bars around that close routinely poke 0.1–0.2 ATR through the line before the close is decided. A stop on the edge is a stop on the noise. A stop 0.15–0.30 ATR inside is a stop on the structure, because a close that deep inside the box means the breakout is no longer a breakout.
For an option, the stop is set on the underlying and translated to premium through delta and gamma. The translation matters because a 0DTE contract does not lose 100% of its premium when the underlying hits the stop; it loses delta times the move, less the gamma the move burns off.
| Contract (0DTE) | Bid | Ask | Δ | Γ | Θ per day | Volume |
|---|---|---|---|---|---|---|
| SPY 762 C | 1.04 | 1.05 | 0.715 | 0.241 | −3.42 | 591,388 |
| SPY 763 C | 0.39 | 0.40 | 0.436 | 0.315 | −3.50 | 664,771 |
| SPY 764 C | 0.15 | 0.16 | 0.197 | 0.197 | −2.76 | 369,054 |
Take the real box from the afternoon session and suppose a break: entry at 762.90 on a bar that closed above the 762.80 edge, structural stop at 762.60, which is 0.20 inside and about 1.2 ATR of that afternoon's tape. The underlying risk is 0.30. Through the 763 call at 0.40 with a delta of 0.44 and gamma of 0.315, a 0.30 adverse move costs about 0.13 of delta and gives back about 0.01 of gamma, so the premium at the stop is roughly 0.28: the stop costs 30% of the premium, not all of it. Through the 762 call at 1.05 with a delta of 0.72, the same stop costs about 0.21, or 20% of premium, and the entry costs two and a half times as much per contract. Through the 764 call at 0.16, the stop costs 0.05, or 31%, and the contract has almost no delta to pay you on the run.
The one thing the translation cannot fix is time. Theta on the 763 call is about 3.50 per day, which is on the order of a cent a minute in the last two hours. A break that pauses for ten bars costs you nearly a tenth of a 0.40 premium in theta alone. That is why the acceptance read matters even after you are in: a pause is fine, a leak is a reason to leave before the stop.
Two contracts: the scale and the runner
One contract can only be right or wrong. Two contracts let you be right twice in different ways: once at the first target, where the fake-out risk is retired, and once on the runner, where the no-test run pays. Everything in this section assumes at least two, and scales to four or six by the same rule.
First scale: 50% at 1R, or at the first pullback tell, whichever comes first. The study's 45% rate of reaching 1R before the stop is the reason the scale is there. Once half the position is closed at 1R, the remaining half can be stopped at breakeven and the trade nets positive. The pullback tell that triggers the scale early is the same signature that predicted failure at the break: an upper wick over a third of the bar, or a volume bar that drops below the box average. If you see it before 1R, scale anyway; the runner is now free.
Runner: trail on structure, not on dollars. Move the stop under each M1 swing low as it forms, or under the close of the last full-bodied bar, or under the 9 EMA on a close, and pick one of those before you enter. The trail is what pays you for the 29% of runs that never retest and the 15% of momentum-bar breaks that reach 3R. It is also what the room read is for: on an open-air break the runner trails until it is stopped; with one wall in range, the runner has a fixed target at the wall and no trail; boxed, there is no runner, the whole position is a 1R trade and you should have used one contract.
Two arithmetic points the calculator makes visible. First, the plan's expectancy is thin at the study's base rates and the runner is what keeps it positive: on two 763 calls with the structural stop above, 45% of trades reach the 1R scale, 15% reach 3R and the rest are stopped, which nets to roughly +1 dollar per two-contract trade before commissions. Take away the runner and it is negative; add the bar filter and the dollar-room gate and the stopped share is what shrinks. That is the whole argument for two contracts and for skipping bad bars, in one number. Second, the stop in premium terms is the number to size from, not the premium itself: two 763 calls at 0.40 are 80 dollars of capital but about 24 dollars of risk at the structural stop, and a trader who sizes to the 80 is trading a third of the size the plan allows.
The tickers: where the same plan needs a different contract
The study's run rates were nearly identical across the five names, from 40% on IWM to 46% on AAPL, and the momentum-bar profile ran 52–62% on each. The chart does not care which ticker it is. The options chain does, and the differences are in spread, gamma and how much a 1.5 ATR run is worth against them. For the full ranking of scalping tickers by liquidity and window, see 0DTE Scalping Tickers; the notes below are only what changes the execution plan.
| Ticker | Contract for the plan | What is different |
|---|---|---|
| SPY | 0DTE, 0.45–0.60 Δ, one strike either side of ATM | Penny-wide near the money; dollar room is the only gate. Dealer gamma can extend or reverse index breaks near large call strikes |
| SPX | 0DTE, same delta; one contract equals ten SPY | "Two contracts" is a much larger position; cash-settled, no assignment, wider spread in dollars but similar in percent. The two-contract plan usually becomes a one-contract plan with a 50% scale done by rolling to a spread |
| QQQ | 0DTE, 0.45–0.60 Δ | Larger ATR in dollars than SPY for the same spread: more dollar room, so afternoon boxes stay tradeable longer |
| IWM | 1DTE or the nearest weekly, 0.50 Δ | Spread is two to four cents on a cheaper premium; 0DTE gamma is punishing on a fake-out. Use one more day of time and accept slower delta |
| TSLA | Weekly, 0.40–0.50 Δ | ATR in dollars is huge; a 1.5 ATR run pays even through a ten-cent spread. The structural stop in premium is larger in dollars, so the same risk budget means fewer contracts |
| AAPL | Weekly, 0.45 Δ | Highest run rate in the study and the cleanest bars; ATR is small in dollars, so midday boxes fail the dollar-room test earlier than TSLA |
Room checker: the pre-entry read
The checker below is the article's rules as a checklist, weighted the way the study weighted them: the break bar carries most of the score, the dollar room carries the next block, acceptance after the break can veto everything, and the context items are deliberately light because they measured at two points or less. The "edge already tested five times" line has a weight of zero on purpose, so that the checker does not teach a rule the data refused.

Failure modes, in the order they cost money
Chasing the third bar. The momentum-candle entry is the first bar. By the third bar beyond the edge the entry is a full ATR above the level, the structural stop is 1.5 ATR away, and the 45% 1R rate has become a 45% chance of a move that is now the whole run. If you missed the first bar, the study's answer is the E3 limit, not a later market order.
Stop on the edge. The median failed break closes back inside within two bars and the bars around it wick through the line first. A stop at the edge is hit by the wick on trades that would have held. A stop 0.15–0.30 ATR inside is hit only by a close that means something.
Scaling all of it at 1R. The 1R scale exists to fund the runner. Closing everything at 1R turns a plan with positive expectancy on a 45% win rate into a plan that needs a 50% win rate, and throws away the 15% of momentum-bar breaks that reach 3R.
No runner in a box, or a runner into a wall. The room read is the exit rule. A runner trailing into a wall one ATR away is a 1R trade with extra theta; a runner in open air with a fixed 1R target is the missed 3R.
Trading a good bar in a dead tape. The break bar can pass every test and the run can arrive on schedule at 1.5 ATR and still not clear the spread, because ATR in dollars has halved since the open. That is the SPY afternoon, and the dollar-room line in the checker is there to catch it before the bar does.
Skipping a good bar because the box looked wrong. The mirror image, and after this study the more expensive mistake. The box height, the range position and the clock did not change the odds. A full-bodied close on volume at 13:20 is the same bet as one at 09:50.

Frequently asked questions
Why did the study measure runs in ATR instead of dollars or percent?
Because a breakout on TSLA and a breakout on SPY have to be compared on the same scale, and ATR is the scale the chart uses. The cost of that choice is exactly the sideways effect the article describes: a 1.5 ATR run is the same event on the chart in the morning and in the afternoon, but not the same event in the option. Measure the setup in ATR and price it in dollars; do not confuse the two.
Does the flat result on box height mean compression does not matter?
It means that in this operationalisation, a 20-bar box measured in ATR, compression did not change the odds of a 1.5 ATR run in the next 10 bars. Tight boxes ran 44% and wide boxes 41%, a difference inside the confidence interval. Compression may matter over longer horizons, or measured differently, and it still matters for dollar room because a tight box usually comes with a small ATR. What it does not do is license skipping a good bar.
If 71% of runs retest, why not always wait for the retest?
Because the 29% that do not retest are disproportionately the momentum-bar breaks, which is where the no-test rate reaches one in five, and because the retest fills in the same two-bar window in which 70% of breaks are failing. Waiting trades the fake-outs for the missed runs; the bar tells you which side of that trade to be on.
Why two contracts and not one larger contract?
A single contract cannot be scaled. The plan's expectancy comes from retiring the risk at 1R on half the position and letting the other half run with a structural trail. With one contract you have to choose between the 45% 1R outcome and the 15% 3R outcome before you know which one you are in. Two cheaper contracts at a slightly lower delta beat one expensive one for this plan; the calculator shows the arithmetic.
How is the structural stop different on SPX?
It is the same stop on the same chart, but one SPX contract carries ten times the notional of one SPY contract, so the premium at risk per contract is ten times larger and the two-contract plan is usually one contract with a 50% scale done by legging into a vertical instead of selling half. Cash settlement removes assignment risk, which matters when a runner is held into the last minutes.
What about the second-break entry — is it real?
Unproven. The theory needs the first break to be absorbed by limit sellers at a known boundary, and the study found no penalty for known boundaries. It remains a reasonable way to re-enter a box you were stopped out of, and it should be treated as an E1 on the second bar with the same tests, not as a separate edge.