Every breakout comes out of a range, but not every range is worth watching. The difference between a coiled market and aimless chop is measurable — and this lesson gives you three ways to measure it, plus the uncomfortable finding about what the measurement actually buys you.
What is happening while price goes nowhere
A range is a temporary agreement. Buyers will not pay above one price, sellers will not sell below another, and price rotates between them.
Three things accumulate while that agreement holds:
- Resting limit orders at both boundaries, from participants happy to trade at those prices.
- Stop orders just beyond both boundaries — from everyone positioned inside the range. A short filled near the top puts its stop above the range high, because anything tighter gets hit during normal rotation.
- Breakout orders from traders waiting for the level to give way.
Volatility contracts during this because neither side is forcing anything. Bar ranges narrow, pullbacks get shallower, and the market coils — not mystically, but because the distance between where buyers and sellers are willing to act is shrinking.
Three ways to measure compression that you can code
Feelings do not survive contact with a live chart. Pick one of these and use it consistently.
Measure 1 — the ATR ratio. The cleanest single number.
compression_ratio = ATR(5) / ATR(20)

  < 0.70   meaningful contraction
  < 0.55   tight
  > 0.90   not compressed
Measure 2 — range width contraction. Compare the width of the last twenty bars against the twenty before them. Under about 60% is a genuine narrowing.
Measure 3 — pullback depth decay. Measure how far price retreats from the boundary on each test, as a fraction of the range width. If those depths shrink monotonically across three or more tests, one side is being pushed:
pullback_depth[i] = (boundary − swing_low[i]) / range_width

depths falling across 3+ tests  →  directional compression
depths random                   →  neutral range
That third one is worth more attention than it usually gets: it is the difference between a range that is merely quiet and a range where one side is steadily losing ground.
Good compression versus random chop
Score the range in front of you. Each condition is worth a point, and two of them subtract:
compression_quality = 0

+1  boundary touched 3 or more times
+1  range width contracting
+1  pullback depths decreasing
+1  volume at or above the session baseline
+1  no closes outside the boundaries
−2  three or more wick violations of the boundary
−1 wick extremes scattered far from the body clusterScore a range and see where it lands:
What compression actually buys you — measured
Here is where we part company with most breakout teaching, and with the tidier version of this method.
We took 490 SPY sessions and the first breakout of each, then split them by how much the range had contracted beforehand.
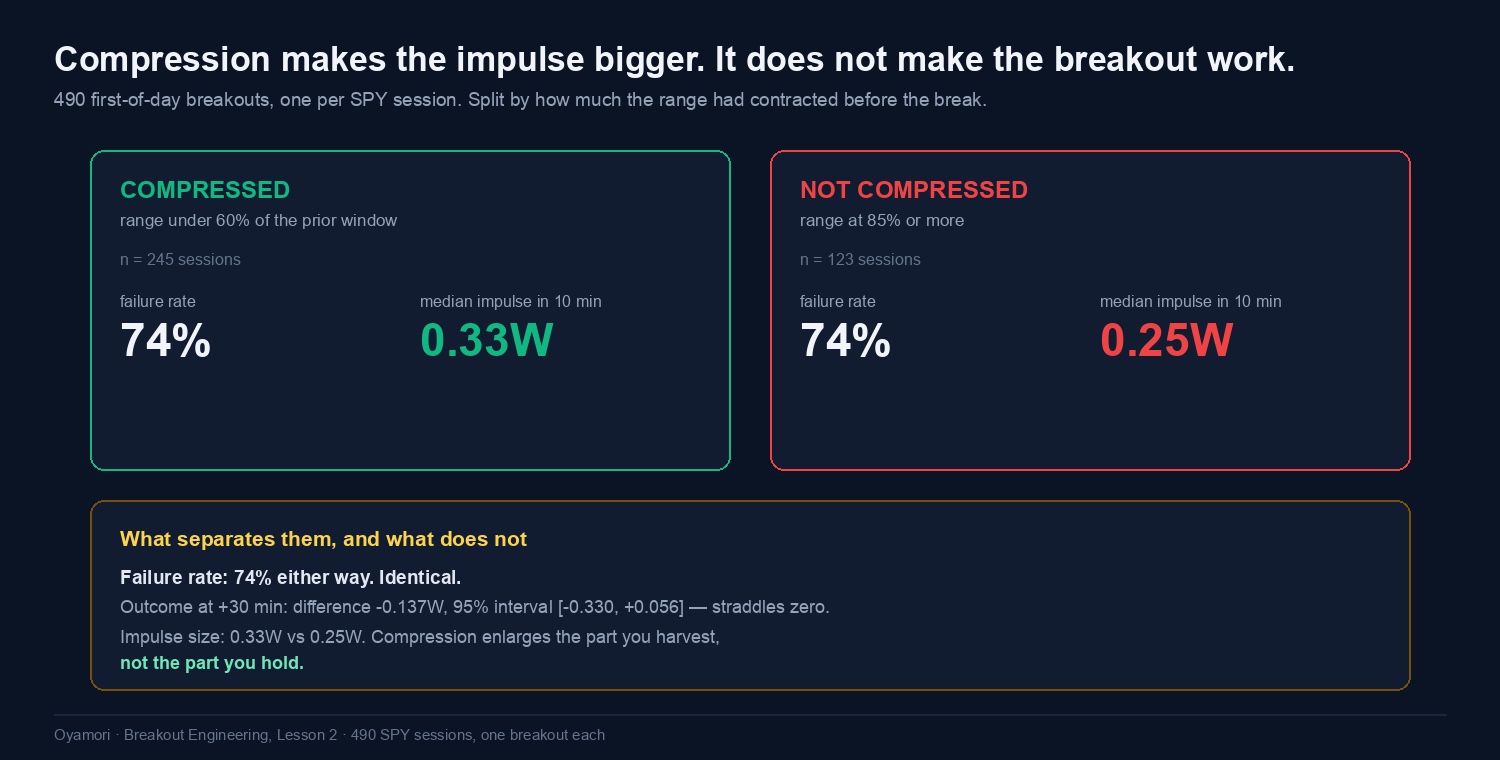
The failure rate is identical. The difference in outcome at +30 minutes was −0.137 range widths with a 95% interval of [−0.330, +0.056] — straddling zero, with the point estimate slightly against compression. Sorting the compressed group further by the quality score above did not separate them either: failure rates ran 71–77% across score buckets.
What compression does change is the size of the first move. 0.33W against 0.25W — about a third bigger.
Why does this contradict what everyone teaches?
Partly because the usual claim is never tested, and partly because of what gets remembered. A tight coil that explodes into a trend day is vivid and gets screenshotted; a tight coil that breaks, fails, and chops sideways for an hour is forgotten. Our sample contains both in their real proportions. It is also worth being clear about the limits: this is SPY, one-minute bars, one breakout per session, 490 sessions, measured over a 30-minute horizon. A different instrument, a longer horizon or a different definition of compression could move it. What the test does rule out is a large effect — the interval excludes anything better than about +0.06W.
What you should take from this lesson
- Measure it. ATR(5)/ATR(20) under 0.70, or a 20-bar range under 60% of the previous window. Pick one and be consistent.
- Demand participation. Narrowing on dead volume is absence, not coiling.
- Watch pullback depth. Shrinking retreats from one boundary tell you which side is losing.
- Expect a bigger impulse, not a better outcome. Set your harvest target from the compression quality; set your expectations from the 74%.
Next: the boundary — why a single line is the wrong model, and where the trigger and the invalidation actually belong.