Ask why breakouts move fast and you get an answer about momentum, or buyers stepping in, or the market wanting to go. Those describe the result while wearing the costume of an explanation. The mechanism is duller: above a range the order book is close to empty, and the orders that fire there do not care what price they pay. Nobody has to feel bullish for the impulse to happen. It is plumbing.
The book above a range is a desert
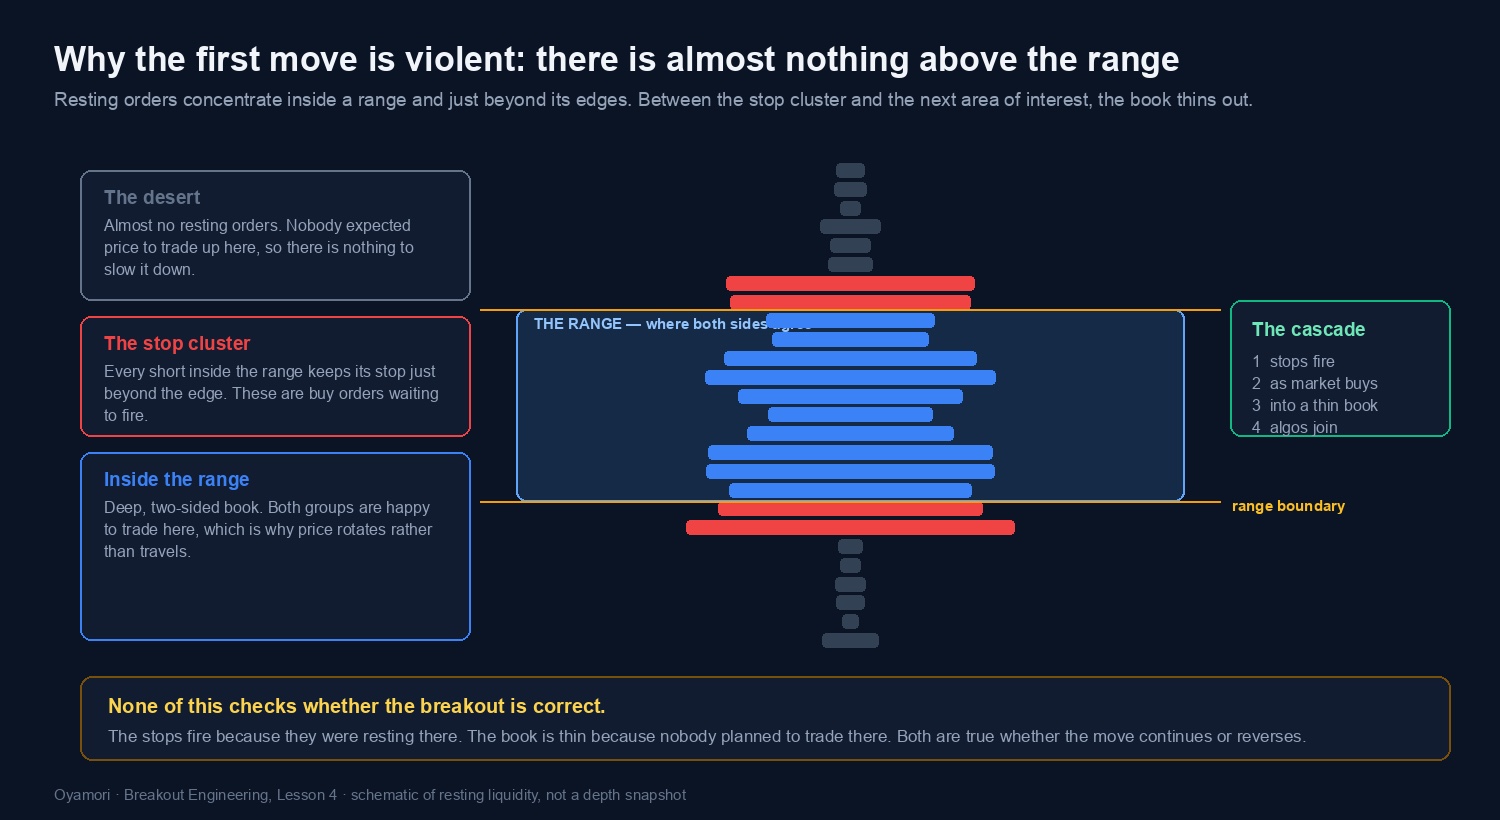
There is real size resting at the inner edge of the range — the price sellers have been defending. Above it, for the next fifteen or twenty cents, close to nothing: a few hundred shares scattered across nine price levels. Then real size again at the prior session close, because participants who never looked at your range still care about that.
The desert is not there because sellers left. It is there because price has not traded in that region for twenty minutes, and limit orders get placed where people expect trade. Market makers quote around the current price. Responsive sellers offer where they have been getting filled. Nobody rests size at a price irrelevant for a third of an hour. Balance concentrates liquidity at its own edges and starves everything outside them.
The wall clears one of two ways. It gets eaten — a buyer who has worked an order all range finishes it by paying through. Or it gets pulled — the defending seller fills what they needed and cancels the rest, and on the next refresh the wall is gone. The pulled version looks like a weak drift on a candlestick chart. Sometimes it is the strongest tell available, because the only thing holding the range together has walked away. You cannot tell which from OHLCV bars, and that is a real limit of bar-based trading.
Stop orders are negative liquidity
A stop order is not resting in the book. It sits at the broker or the exchange as a conditional instruction and contributes zero liquidity while it waits. The moment its trigger price prints, it converts to a market order and enters as a taker — consuming the book rather than adding to it.
before trigger:   stop contributes    0 to available offer size
at trigger:       stop contributes   −N to available offer size

net effect: the book gets thinner at exactly the moment
            it needs to be thicker
That is why breakouts are violent rather than merely directional. Ordinary buying meets a book that refreshes between orders. Stop-driven buying arrives at once, into a book already depleted by the same buying that triggered it.
And the stops are not at the boundary. As lesson 3 set out, they sit above the outer edge, thickening at round numbers and at the range extreme. A close a cent past the inner edge looks like a breakout on a chart while mechanically nothing has fired.
Four waves, in order
Wave one is involuntary and largest. Wave two is voluntary but pre-placed, sitting in the same region for the same reason. Wave three is human and seconds behind, which is why heavily-watched levels travel further than levels nobody is charting.
Wave four is the interesting one. Momentum programs do not trigger on your boundary — they trigger on statistics: a return exceeding a multiple of recent standard deviation, a volume anomaly, a shift in realised volatility. Those conditions are manufactured by waves one to three. The cascade creates the numbers that summon more buying.
Hold the model loosely — on a fast tape the waves overlap and are indistinguishable. What survives is the ordering: mechanical first, algorithmic last, algorithmic triggered by mechanical.
Covering, liquidation, and why down is faster
Short covering is traders who are short without stops choosing to get out — slower, staggered, continuing for minutes. It is much of why the first pullback after a break is shallow: every dip is bought by somebody closing. Long liquidation is the mirror on a breakdown and is structurally larger, because longs outnumber shorts in equity products by a wide margin.
Compression lowers the threshold — and what we found when we tested it
A momentum program fires when a move exceeds K standard deviations of recent returns. Tight compression shrinks that standard deviation, so a smaller absolute move clears the bar.
threshold_move  ≈  K × stdev(returns, N)

tight compression → small stdev → small threshold → easy to trigger
loose chop        → large stdev → large threshold → hard to trigger
Compression stores no energy. It lowers the bar. That is the mechanism the coiled-spring metaphor was reaching for and getting wrong.
It is also where our data declines to cooperate. Across 490 SPY sessions and 489 first breakout attempts out of compressed ranges, 09:45–14:30 ET, the median impulse was 0.33W out of a compressed range against 0.25W out of an uncompressed one — W being the width of the range that broke, median 1.00 point on SPY. Directionally that is the threshold story. Nothing else follows it. Failure was 74% whether the range was compressed or not, the outcome difference was −0.137W with a 95% interval of [−0.330, +0.056] straddling zero, and sorting by compression quality did not separate outcomes: 71% to 77% failure across every bucket. A separate study on 236 sessions found compression did not predict expansion size either — paired difference +0.0055 ATR, 95% CI [−0.0071, +0.0182].
The threshold effect is real and it is a weak edge. It explains why the impulse exists; it does not tell you which impulse to trust, which is the distinction lesson 2 opened.
This fires whether the breakout is real or fake
Velocity has four causes and none is sentiment: the region above is structurally thin; the arriving flow is price-insensitive; the buying that clears the wall is the same buying that triggers the stops, so depletion and demand peak together; and compression has lowered the bar the cascade then clears.
Every one operates before the market can reveal whether real supply waits overhead. By the time supply shows up, if it does, the impulse has already happened. In our study of 489 breakouts, the ones that ultimately failed still produced a real move first.
A failed breakout delivers roughly two-fifths of a real one, and the median failure takes four minutes to confirm. The impulse is not evidence; it is inventory being released. Which is why the state matters more than the candle — a cascade moves you from armed to attempt and licenses nothing beyond that:
When the velocity does not arrive
Sometimes every bar-based condition is met and price walks instead of jumping. Four causes, three of them checkable before the break.
| Cause | Diagnostic | Response |
|---|---|---|
| Stop cluster already spent | Two or more prior failed breaks or sweeps | Skip |
| Thick overhead supply | A session level within one range width | Skip, or take a much smaller target |
| It was never a range | No clean boundary touches, so nobody is trapped | Skip |
| Midday | The clock — SPY volume routinely halves from about 11:45 to 13:15 ET | Half the fuel, so halve the expectation |
How does any of this work on SPX, which has no order book?
Indirectly. SPX is a computed index — you cannot buy it and there is no book to deplete. The tradable proxies all have books: SPY, ES futures, and SPX options. When SPX "breaks a level", ES and SPY break correlated levels, their books behave as described here, and the index prints the result. So SPX levels are softer than SPY levels, no single book defending them, and SPX option pricing responds to ES sooner than to the index calculation. Trading SPX options off SPX levels, watch ES for the actual break. Mechanism, not something we have measured.
What you should take from this lesson
- The book above a range is thin because price has not traded there, not because sellers are absent. Each market order consumes several price levels instead of one.
- Stop orders are negative liquidity — invisible while resting, consuming the book the instant they convert. It is thinnest when the largest flow arrives.
- Four waves: protective stops, resting breakout entries, human clicks, momentum programs — the last triggered by statistics the first three manufactured.
- Compression stores no energy; it lowers the trigger threshold. Real mechanism, and across 489 breakouts it still did not separate outcomes.
- Every cause of the impulse operates before supply can reveal itself. That is why failed breakouts move first too, at about 0.43 the size at five minutes.
Next: the impulse itself — how to measure it while it is still happening, and why its size tells you nothing about whether the breakout will hold.