Edges
Why Price Reverses at Key Levels: The Four Borders of a Day
Why price reverses at key levels has a shorter answer than most explanations allow: because someone's decision was already written there. What matters is who wrote it — and there are only four authors. The clock, a bigger chart, the session's own average price, and the market's memory of where it stopped before.
On 1 September 2026 the S&P 500 turned four times, and each turn happened at a different one of those four borders. Every number below is checkable: the chart levels come from the SPX chart, and the price action is verified against SPY's own bars for the same session.
The four borders, and what builds each one
| Border | What creates it | Examples | Strongest when |
|---|---|---|---|
| The clock | trading starting and stopping | opening range high/low, prior day's high/low, the gap edge | early — it decays through the session |
| A bigger chart | participants on a slower timeframe | daily cloud or moving average, weekly level, higher-TF zone | any time — it does not care about your chart |
| The session mean | everyone's average price today | true session VWAP, VWAP bands, the anchored slow cloud | in balance; it is a location, not a signal |
| Memory | price having already stopped there | this session's own high or low, equal highs, a double top | on the second test, and only by comparison |
The taxonomy matters because the four fail differently. A time border goes stale. A higher-timeframe border produces reactions far bigger than your stop. The mean gets mistaken for a direction. Memory borders are exactly where the stops are, so they get swept before they work.
The session: four turns, four different authors
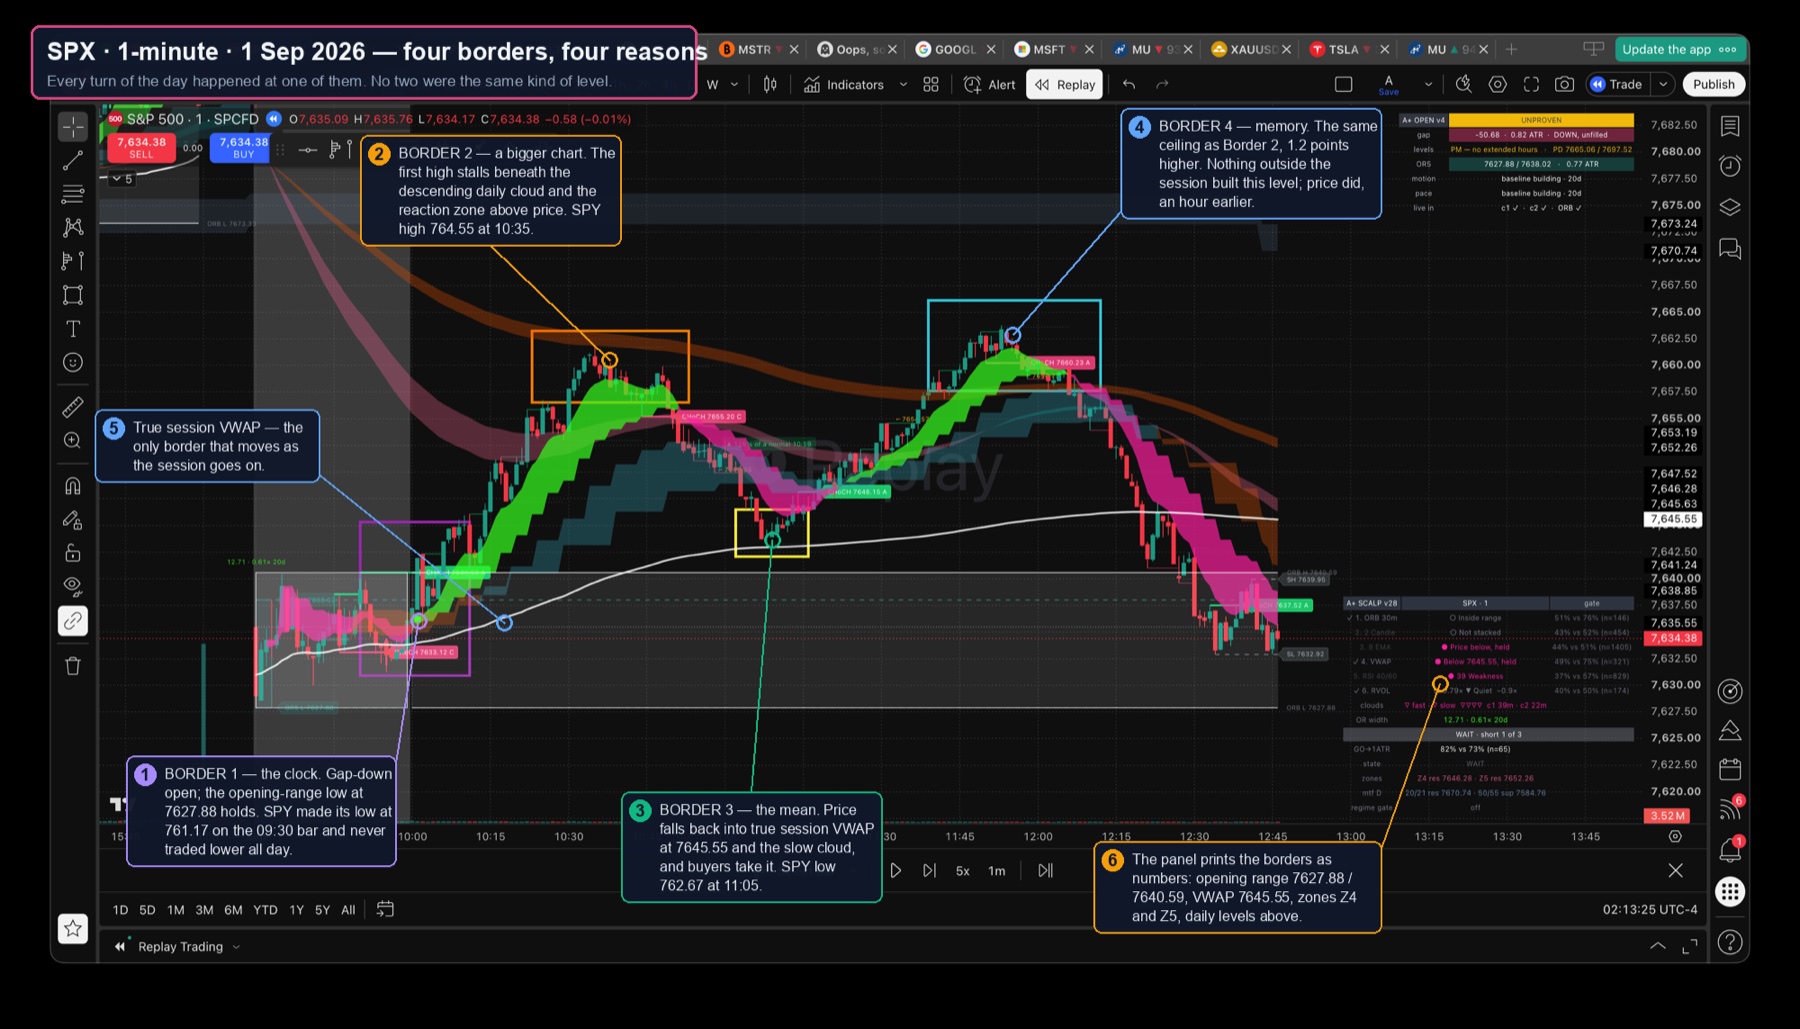
Border 1 — the clock. The session gapped down and spent its first half hour refusing to go lower. SPY printed its low of 761.17 on the 09:30 bar and never traded below it for the rest of the day. Convert at the index ratio and that is 7627.9 — the chart's opening-range low reads 7627.88. The floor was not an agreement about value; it was the boundary the first thirty minutes drew.
Border 2 — a bigger chart. The first push higher stalled at SPY 764.55 (10:35), directly beneath a daily cloud sloping down into the session and a reaction zone printed above price. Nothing in the morning built that ceiling. It belonged to a slower participant who happened to have a level there.
Border 3 — the session mean. The pullback stopped at SPY 762.67 (11:05) — at true session VWAP, 7645.55 on the chart, with the slow cloud beneath it. Price returned to the average price everyone had paid that day and was bought.
Border 4 — memory. The second push topped at SPY 764.67 (11:50), the chart marking the session high at 7663.64. That level had no external source at all. Price had stopped there an hour earlier, and that was the entire reason it stopped there again.
Click through the same session border by border:
A real border survives a change of timeframe
Switch the same session to 5-minute candles and all four boxes are still there, in the same places. That is not a small detail — it is the practical test that separates a border from a wiggle. A level that only exists at one resolution was drawn by the resolution, not by participants.
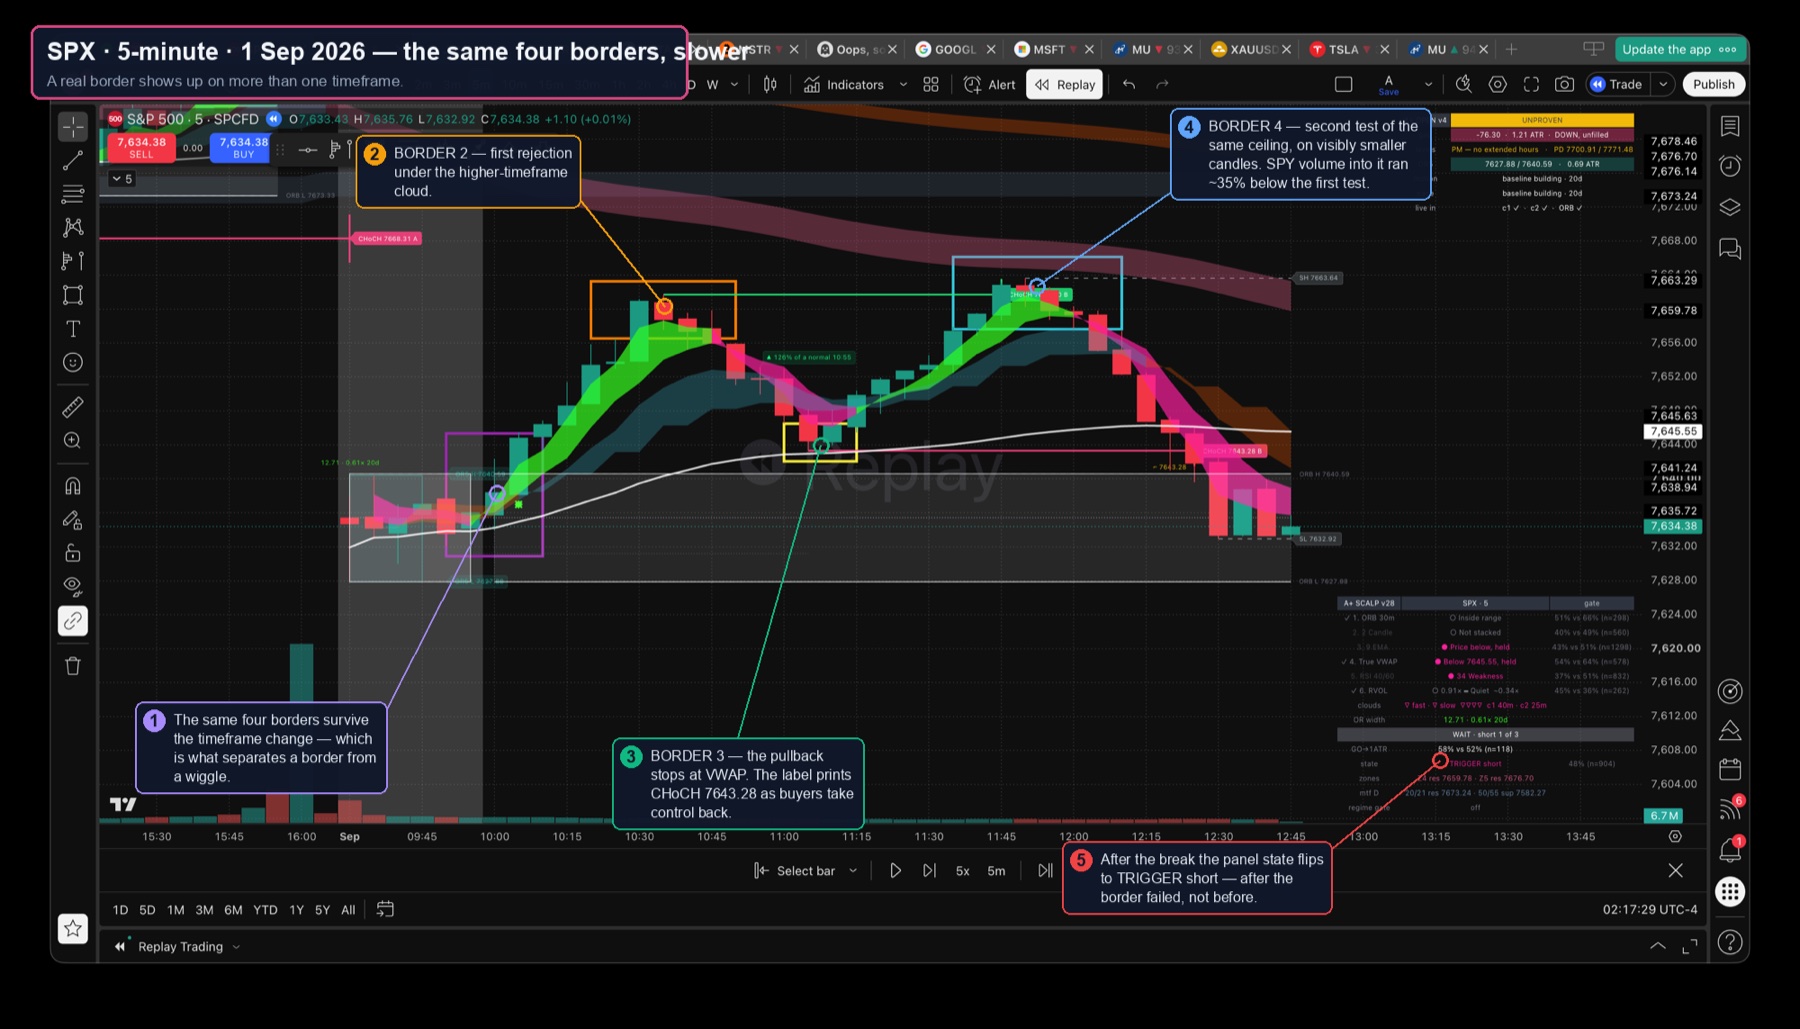
The slower chart also strips out something worth noticing: on the 5-minute view the second push into border 4 is made of visibly smaller candles than the first push into border 2. The information that mattered was easier to see with fewer bars, not more.
The same ceiling twice, and only once did it end the day
Borders 2 and 4 were the same price. SPY 764.55, then SPY 764.67 — twelve cents apart, 0.016%. The first one produced a shallow pullback and a higher low. The second one ended the session's uptrend and produced the day's low within forty minutes.
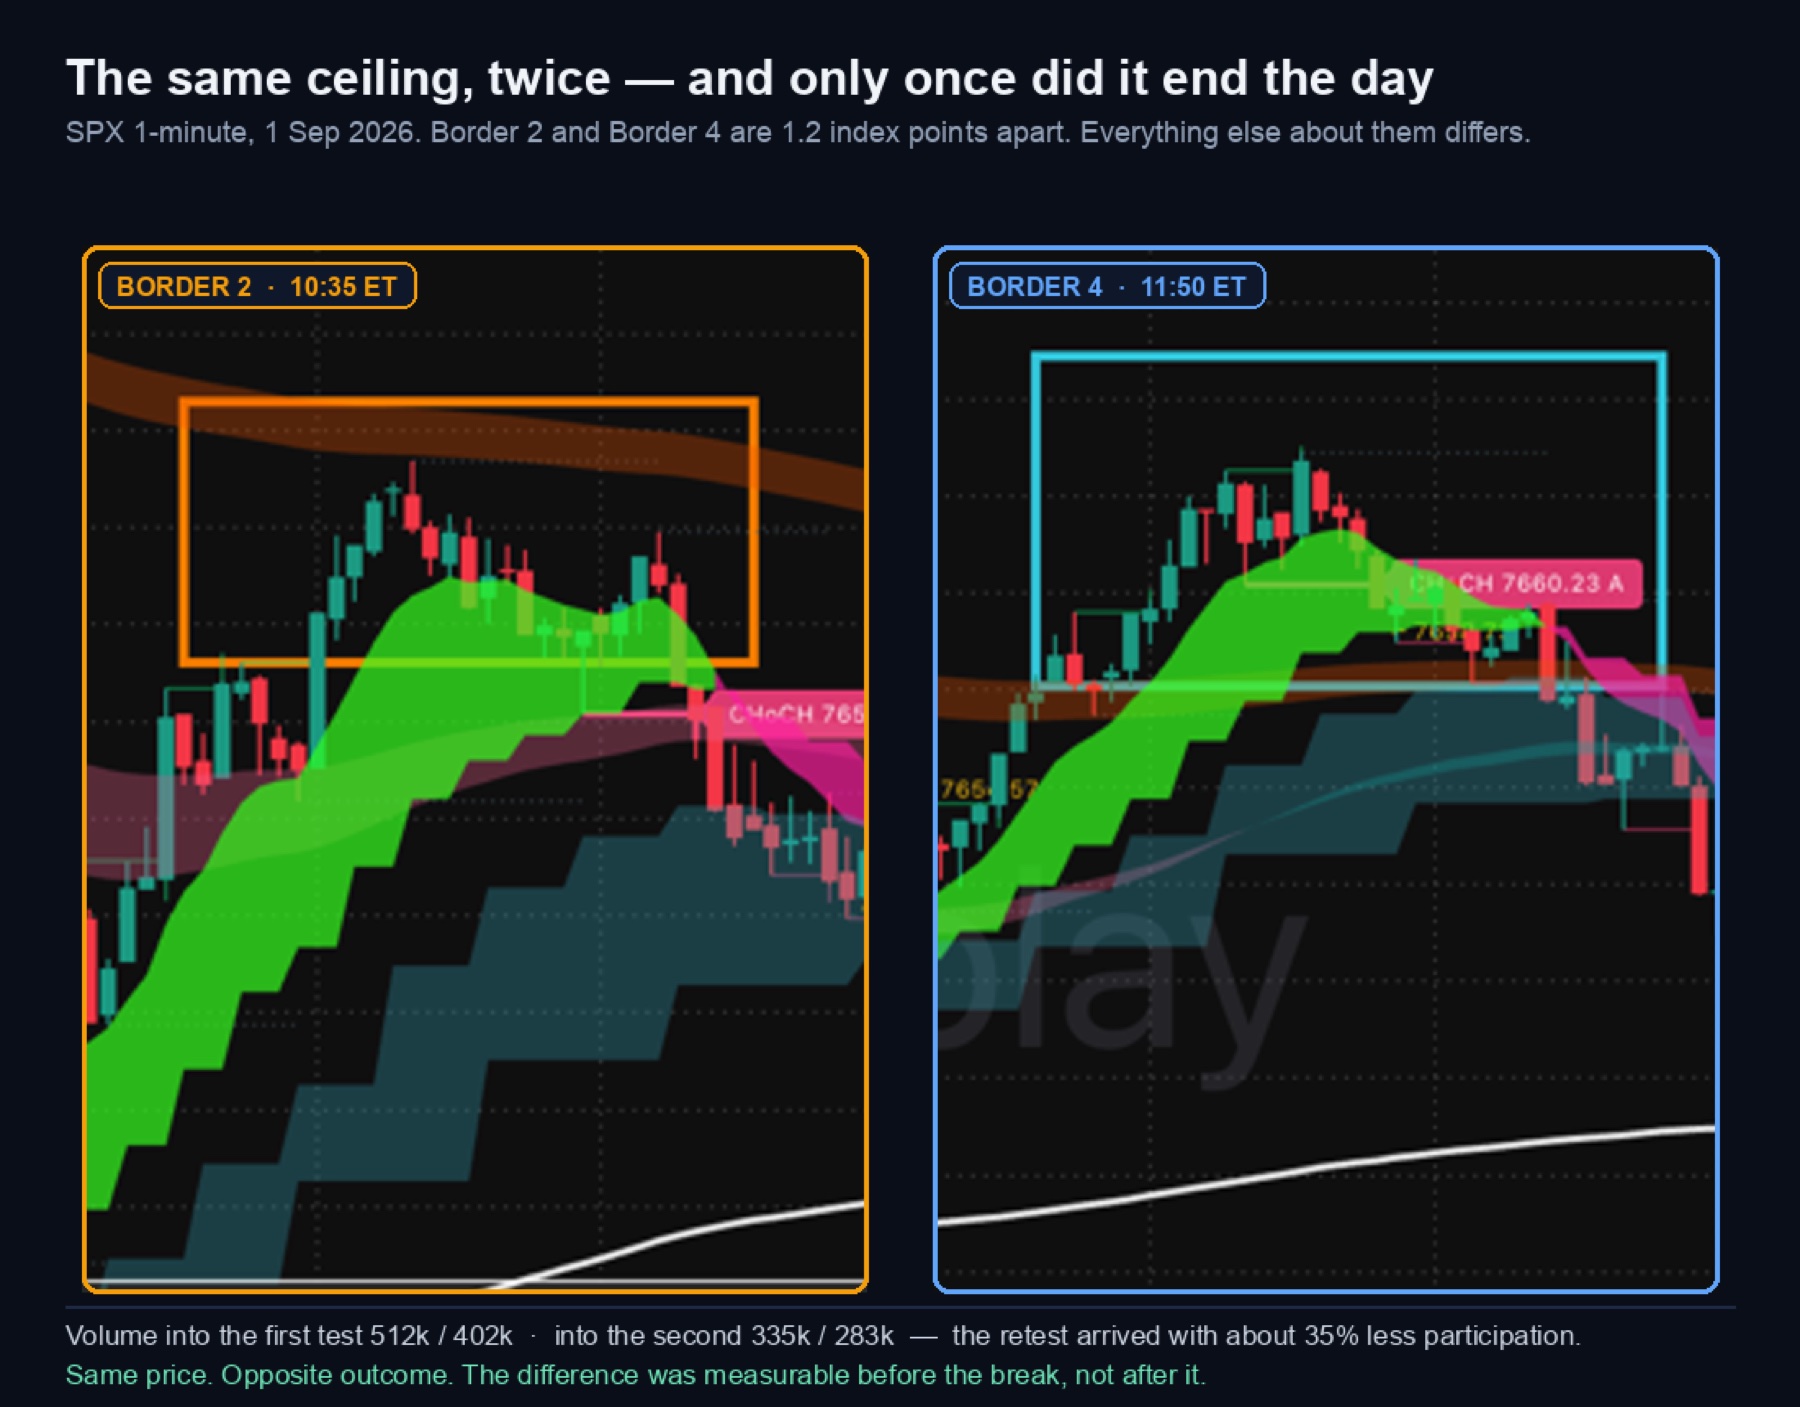
The difference was not the level. It was who showed up:
| Border 2 · 10:35 | Border 4 · 11:50 | |
|---|---|---|
| SPY high | 764.55 | 764.67 |
| SPX (chart) | ~7662 | 7663.64 |
| Volume, two bars into it | 512k / 402k | 335k / 283k |
| Participation vs the other test | — | about 35% lower |
| What followed | pullback to VWAP, higher low | −0.40%, session low |
Then the break itself: as price left border 4, SPY's 12:20–12:30 bars printed 569k, 496k, 594k. Participation dried up into the retest and expanded on the exit. That is the whole tell, and it was available in real time.
Why a border works at all
A boundary holds because orders are resting there, and orders rest where someone already decided something. That is why the four authors matter more than the drawing:
The four turns on 1 September were tiny in isolation — +0.44%, −0.25%, +0.26%, −0.40%. Together they are the day: SPY's whole regular-session range was 761.17 to 764.67, 0.46%. Four borders accounted for all of it.
Identify your own border
The type dictates the confirmation and the failure mode. Describe your level and get both:
The honest part: a border is a place, not a prediction
Two things in this session should stop anyone from turning the framework into a signal.
The same price did opposite things. Border 2 and border 4 were 0.016% apart. Had you shorted the first one on the logic that shorted the second one correctly, you would have been run over by a higher low. The level did not decide the outcome; what arrived at it did.
VWAP was an excellent *place* on 1 September and it is a poor *reason*. The full refutation is in [why filter-hunting stops paying](/learning/options-spread-cost-in-r/).
Borders tell you where a decision is likely to be made. Price behaviour tells you whether it was made — which is the same division of labour covered in chart reversal patterns and enforced in the scalp entry checklist. Drawing better boundaries does not remove the need to read what happens at them; it just means you are watching the right places.
Do these four borders exist on every instrument and every day?
The four authors do; their relative importance does not. On an index like the S&P 500 the session mean and the opening range dominate, because so much of the volume is systematic and anchored to them. On a single high-beta name, memory borders and higher-timeframe levels tend to matter more, and the opening range is more often broken than respected. On a quiet day, price may only visit two of the four. The framework tells you what kind of level you are looking at — it does not promise that all four will be present, and it never promises that a level will hold.
The takeaway
Before you mark a level, answer one question: who put it there?
- The clock — opening range, prior day, the gap. Best early, stale by afternoon.
- A bigger chart — daily clouds and levels. Sized by someone larger than you; expect bigger reactions.
- The session mean — VWAP. A place price returns to, not a direction to trade.
- Memory — where price already stopped. Read the second test against the first, and put your invalidation beyond the sweep.
Then wait for the comparison, not the touch. On 1 September the boundary that ended the day announced itself with 35% less volume than its own first attempt — before it broke.