Everything the first four lessons built — the range, the compression, the four boundary levels, the order cascade — exists to make one thing big enough to be worth taking. That thing is the impulse: the first directional leg out of the range. It fires whether the breakout is real or not, which is the whole reason it is the part worth trading.
What the impulse is, exactly
Loose definitions produce loose trading, so here is a tight one.
The impulse is the continuous directional move that begins when price trades beyond the outer level and ends at the first meaningful pause. Each of those three parts needs pinning down.
It begins on a trade, not on a close. The impulse starts at the tick that prints above R_outer, not when a one-minute bar closes there. Trigger on closes and you enter partway in — a real cost, and one to price rather than ignore.
It is continuous. No pullback deeper than about a third of the move so far. A retracement past that means the impulse has ended, whatever price does next.
It ends at the first meaningful pause — a state you can recognise while it is happening, unlike the extreme, which you only know afterwards.
impulse_alive while:
    (extreme - price)  <  0.33 x (extreme - break_price)

impulse_ends on the first of:
    a retracement deeper than one third of the move so far
    three bars with no new extreme
    an opposite-direction bar closing beyond the prior bar's midpoint
Measure extent from the level, not from the close of the breaking bar. Measuring from the close understates every impulse by however far price ran past the level before the bar ended, and makes your records incomparable from one trade to the next.
Three numbers fall out: extent (how far, best expressed in multiples of W, the width of the range that broke), duration (how long), and velocity (extent divided by duration).
Velocity is a measurement, not a forecast
Direction is a claim about where price will be later. Velocity is a claim about the rate of a move already in progress.
Conventional breakout trading is a direction bet: you buy because you think price will be higher in an hour. The impulse trade is a velocity bet: you buy because price is moving quickly in a known direction, and you intend to be out before the direction question is asked.
That explains a failure mode traders misdiagnose. A midday breakout that goes the right way slowly is a losing trade on a 0DTE contract, because spread and decay eat the position while it is being right. Direction correct, velocity wrong.
We have not measured velocity directly. What we have measured is how far price got by fixed times after the break — extent per unit of time wearing a different hat.
Failed breakouts have impulses too — about a third the size
Our study of 489 breakout attempts across 490 SPY sessions (first attempt per session, 09:45–14:30 ET) recorded the best price reached after each break, at fixed intervals, scaled by W. Median W was 1.00 point on SPY, about 0.15% of price.
| Minutes after the break | Median best price, held | Median best price, failed |
|---|---|---|
| +3 | 0.32W | 0.16W |
| +5 | 0.43W | 0.19W |
| +10 | 0.72W | 0.24W |
| +30 | 1.29W | 0.41W |
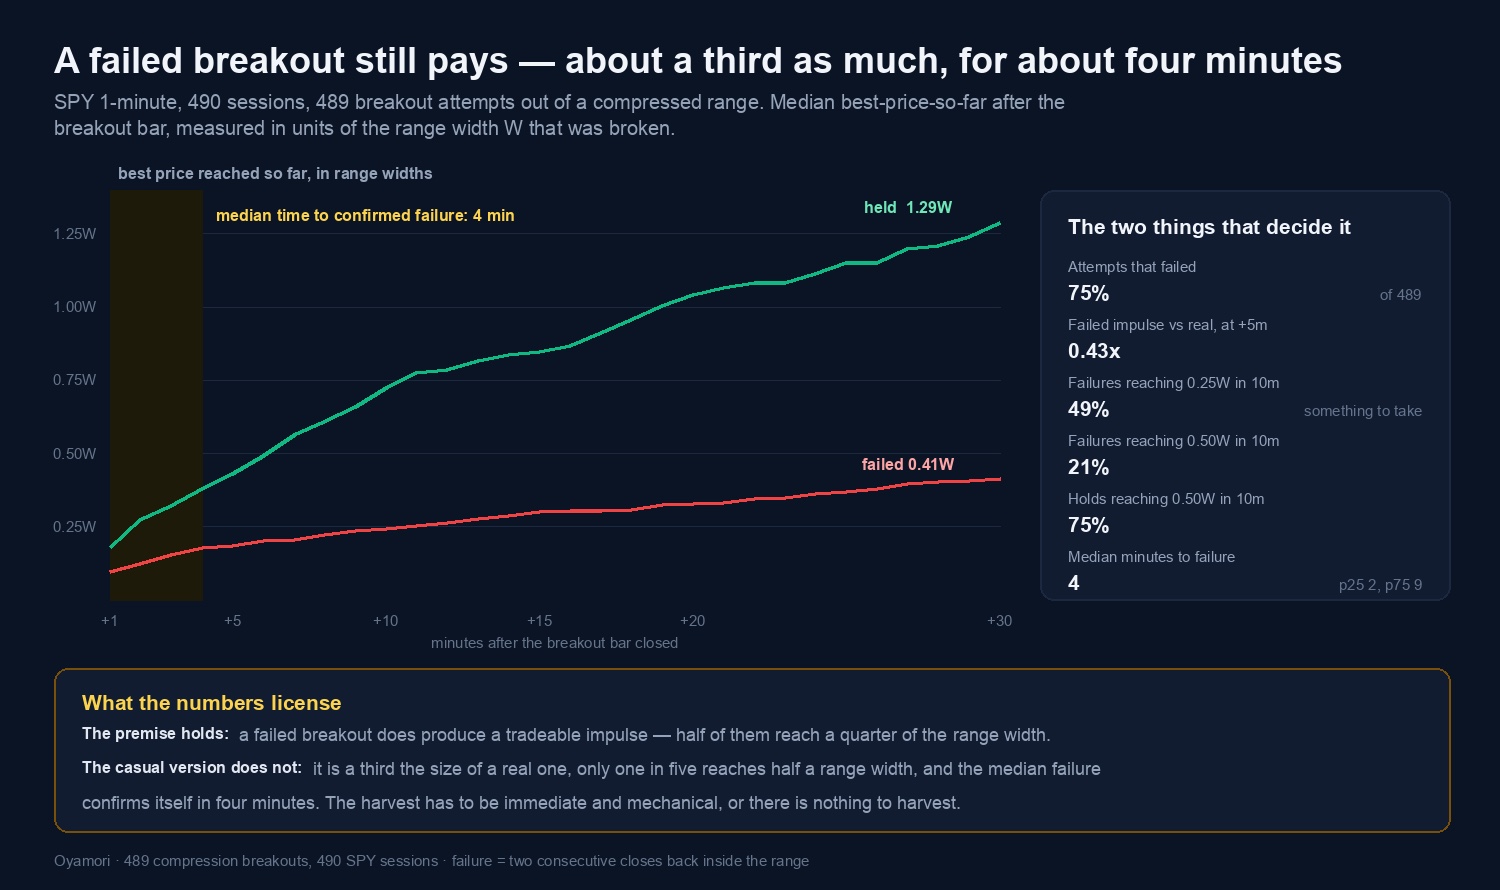
The failed column is the lesson. Breakouts that went on to fail still travelled — a median of 0.19W within five minutes, roughly nineteen cents of SPY out of a one-point range. The failed-to-held ratio is 0.43 at five minutes and 0.34 at ten.
Note the direction of that drift. The groups look most alike early and separate as time passes, which is what the mechanism predicts: divergence needs supply to arrive after price gets there. The failed group then stalls, adding 0.17W between the ten- and thirty-minute marks while the held group adds 0.57W.
Hit rates matter more than medians, because a target either fills or it does not. Within ten minutes of the break, of breakouts that held, 96% reached 0.25W, 75% reached 0.50W and 29% reached 1.00W. Of breakouts that failed: 49%, 21% and 4%. Since three attempts in four failed, that second row does most of the work in any real sequence of trades. A near target gets paid in both outcomes. A far target is a bet on the outcome wearing a target's clothes.
A large impulse is not a valid breakout
Price rips 25 cents in 30 seconds on heavy volume, and it feels like confirmation. It confirms that the cascade fired cleanly — the stop cluster was intact, the book above was thin. Both are facts about the previous twenty minutes of positioning, not about whether size is waiting overhead.
| Impulse character | Mechanism | Harvest |
|---|---|---|
| Large extent, high velocity | Healthy cascade | Full target reachable |
| Large extent, reaching the next level at once | Healthy, but arrived at supply with no pullback | Take it early |
| Small extent, any velocity | Cluster spent, or absorbed | Little to take |
| Large extent, low velocity | Drift into a vacuum, no cascade | No moment to sell into demand |
That table is order-flow reasoning, not something we have measured. What we did measure is the failure rate — 75% on two consecutive closes back inside, 83% on any close back inside — and it did not move with setup quality. Treat impulse character as a guide to sizing the harvest, never as a filter that improves your odds.
The window: four minutes, median
Half of all failures declared themselves within four minutes of the break. That is the outer bound on your decision window, and the harvest window sits well inside it, because you want to sell while the bid is still being lifted rather than after it has stepped away.
Four minutes is not enough time to evaluate a setup. It is enough to execute one you evaluated beforehand. Everything downstream follows: the entry is pre-planned, the first target is set before entry rather than chosen mid-move, and the harvest goes in as a resting limit order in the same action as the entry, so the impulse fills it rather than you reacting to it. A trailing stop cannot do this job — by construction it exits after the reversal has begun, and at this timescale that is too late.
Sizing the harvest before the break
Since the target has to exist before the break, it has to be computed from what you know before the break: the geometry of the range in front of you.
expected_extent = W x extent_multiple      (scaled by compression quality)

harvest_target  = R_outer + (expected_extent x 0.55)
Two properties make this worth doing. The target scales with the range's own width, so it adapts to volatility without being tuned. And placing it past halfway through the expected move puts the fill on the decaying side of the impulse rather than at its peak. Selling the high is not a goal — it is an accident that occasionally happens and cannot be planned for.
On the multiple itself, be honest about what is known. Our measurements give what breakouts reached — 96% of holds and 49% of failures cleared 0.25W within ten minutes — and that is where a first target belongs. What we did not find was any way to predict a better outcome from a better setup: sorting the same 489 attempts by compression-quality score produced failure rates of 71% to 77% across every bucket. Compressed ranges did give larger impulses (median 0.33W against 0.25W), so a tighter range earns a slightly further target and nothing more.
What you should take from this lesson
- The impulse ends at a state you can see. A retracement past a third, three bars with no new extreme, or a decisive opposite bar — not at the high, which you only recognise afterwards.
- Velocity, not direction. You are paid for the rate of a move already in progress, over an interval short enough that the forecast never becomes relevant.
- Failed breakouts pay the harvest. Median 0.19W at five minutes against 0.43W for holds, and 49% of failures still cleared 0.25W within ten minutes, across 489 attempts.
- A big impulse means the cascade was healthy, nothing more. Setup quality did not move the failure rate — 71% to 77% across every compression bucket.
- Four minutes is the median time to a confirmed failure. Plan the entry and the harvest before the break, or you will be planning them after the window has closed.
Next: the pause arrives and the market starts answering — what acceptance looks like mechanically, what rejection looks like, and how long each takes to become clear.